We’re excited to announce our integration with Zapier, giving you a seamless integration between DoiT’s products and the apps you use every day.
If you’re unfamiliar with Zapier, it’s a no-code automation tool that lets you connect your apps with each other into automated workflows (called “Zaps”).
Think:
- When someone registers for your event, add them as a row in a Google Sheet
- When someone fills out a Typeform survey, post responses in a Slack channel
- When someone sets up a meeting via your Calendly link, get an SMS message notifying you
It’s a great tool for accomplishing routine and repetitive tasks automatically, so you can focus on more important work.
Let’s explore five popular DoiT Console x Zapier integrations you can use right away to improve the way you work.
Log an issue in Jira when a cost anomaly is detected
Undetected cost spikes crush confidence in your budgets and forecasts, impact your burn rate, and make it more difficult to understand your cloud spending patterns overall.
Luckily, DoiT customers have access to Anomaly Detection in the DoiT Console, which surfaces potential cost anomalies and their cause without you having to configure a thing. This gives you insights into which resources are causing unexpected expenses, enabling you to take necessary corrective actions.
Example Compute Engine anomaly detected in the DoiT Console
However, detecting cost spikes is just half the battle — you also need your engineers to act on the anomaly’s source to minimize its impact.
With the DoiT Console <> Zapier integration, you can log an issue in Jira (or any other ticket management system) when a new cost anomaly is detected.
This template creates a Jira issue whenever there’s a significant cost anomaly detected (e.g. exceeding $75). It’s perfect for teams who want to keep their budget in check and instantly alert them of any unexpected cloud costs.
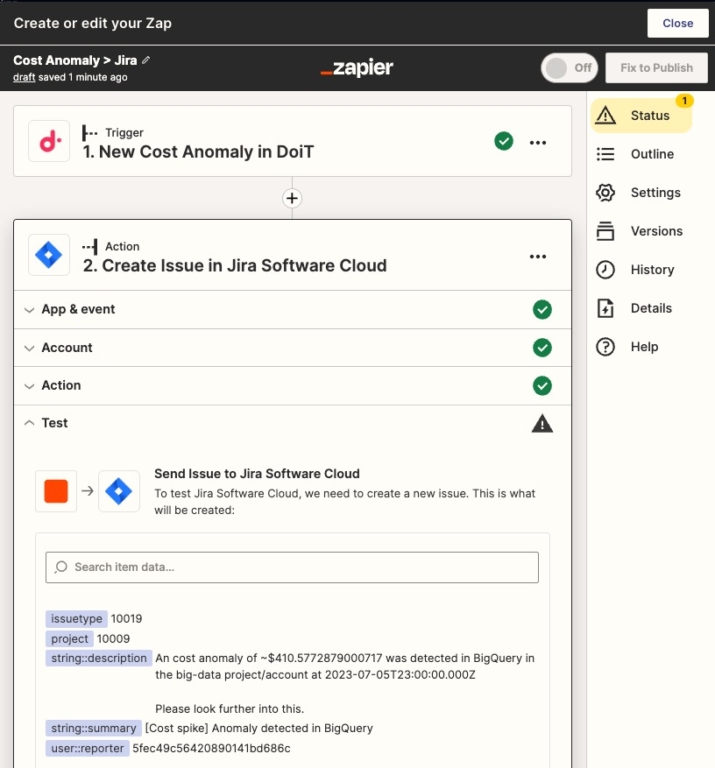
Creating a Jira Task from a Cost Anomaly with Zapier
Get alerted when you’re using a new cloud service
With many users and moving parts, keeping track of your evolving cloud landscape can be difficult. This trigger identifies whenever a new cloud service is being used in your infrastructure.
Whether an engineer is just testing out a new service, or it’s becoming an integral part of your infrastructure, you’ll know about it with this Zap.
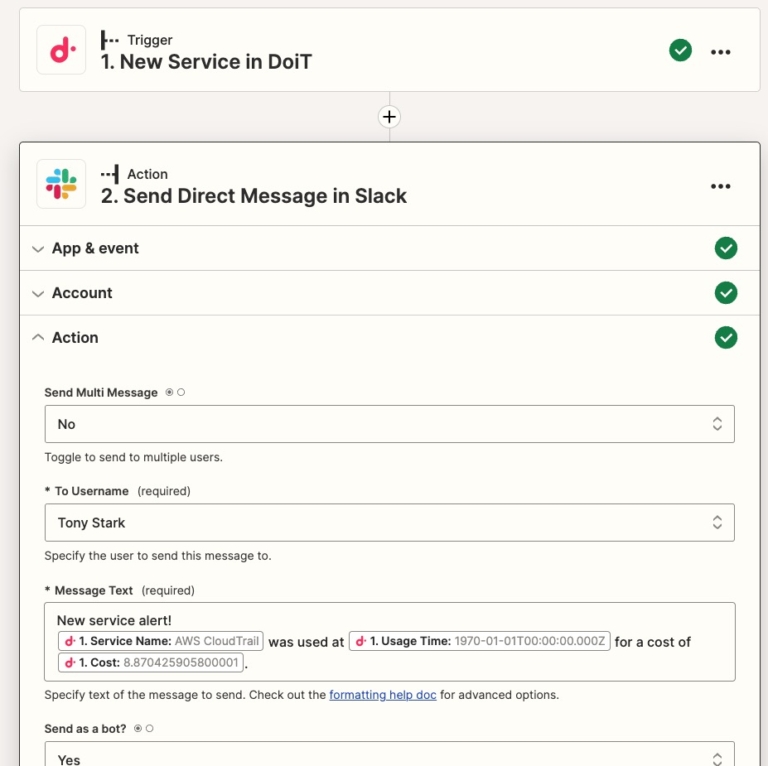
Generating a Slack alert when a new cloud service is used, with Zapier
You can use the “Service Name”, “Usage Time”, and “Cost” fields to customize your alert and give yourself more context.
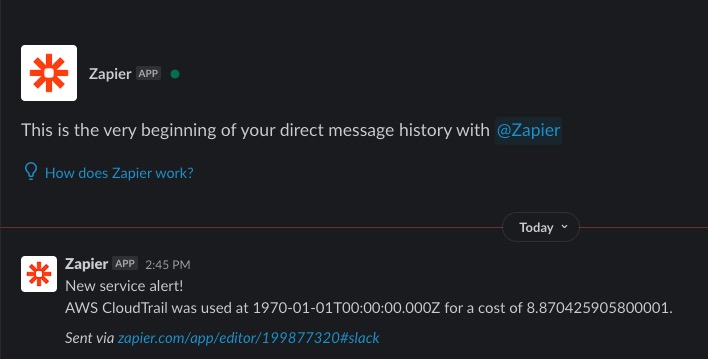
Slack alert detecting a new cloud service being used for the first time.
Produce AI-driven cloud cost analyses
This template is designed to alleviate the pain of manually monitoring and analyzing your cloud resources. When this Zap template runs, it leverages OpenAI’s ChatGPT to review your cloud infrastructure’s activity, performance, and security data to generate comprehensive insights every week.
All you have to do is select an existing Report for ChatGPT to evaluate. In our case below, I’ve selected a report that breaks down my cloud costs by service, over the last 7 days.
It then sends the alert to me in Slack, Teams, or any other messaging app you’d like to receive the message in.
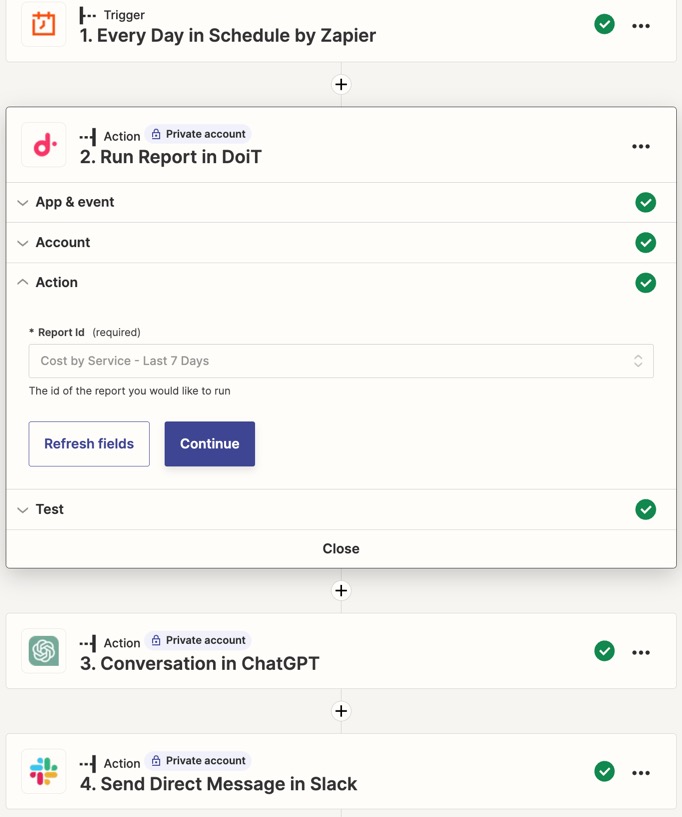
Setting up an AI-generated summary of a cloud cost report with Zapier
And below you can see the output. This is when you or your stakeholders are pressed on time and don’t have time to make sense of cost reports. This Zapier template distills the main insights for you!

AI-generated highlights of a cloud cost report
Stay on top of cloud provider infrastructure issues
If you're new to the DoiT Console, "Cloud Incidents" are events — including outages and other known issues — on Google Cloud and Amazon Web Services that may affect the performance or availability of your services.
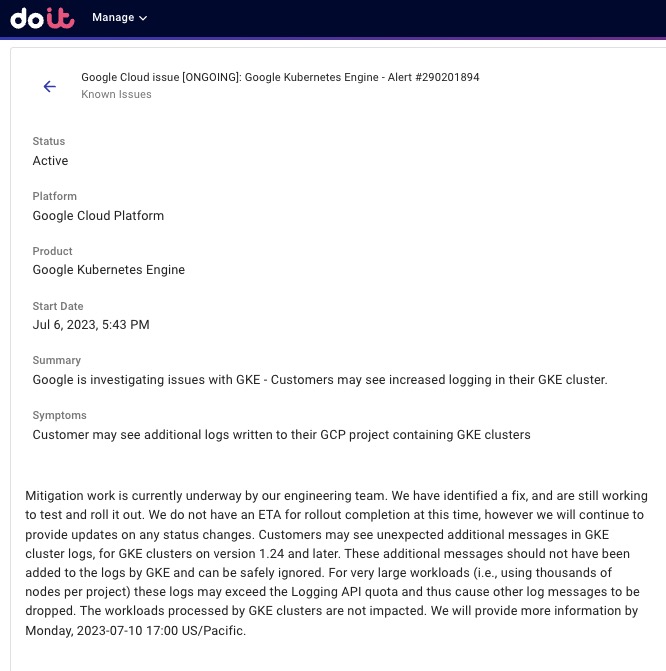
Cloud Incident displayed in the DoiT Console
While these appear in the DoiT Console already, using this integration you can send these alerts to apps like Slack.

Setting up an alert when a new cloud incident is detected, in Zapier
This streamlined process saves you time and ensures you're always on top of any issues that may be affecting your application’s reliability.
A Google Cloud incident sent to Slack via a Zap
Alternatively, you could also submit a ticket through PagerDuty or PagerTree, or text your team when there’s an outage in a service that represents a critical component of your infrastructure.
Receive your cloud invoice where you work
If you’re in finance, you can ensure you’ll never miss an invoice with the “New Invoice” trigger. Use it to send alerts to Slack or Teams when a new invoice is generated.
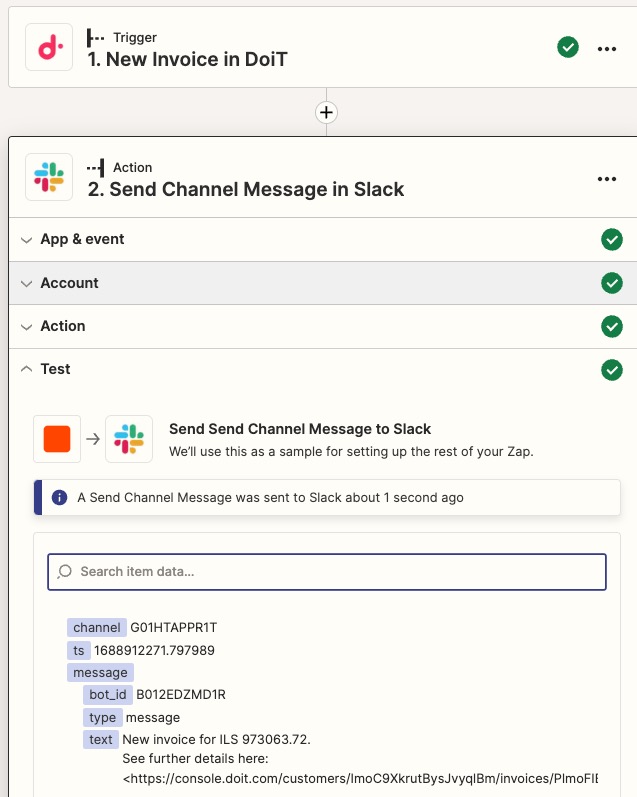
Get alerted when you've received a new cloud invoice, via Zapier
You can even customize your alert to link you to the Invoice’s page in the DoiT Console, where you can examine it more closely and drill down.

Access Zapier integrations in the DoiT Console
Better yet, you can manage and create your Zaps directly from the DoiT Console with the brand new Integrations page.
To access your Zapier Integrations page:
- Open the DoiT Console
- Click on "Settings"
- Navigate to "Integrations"
- Select "Zapier"
From this dedicated page, you have the power to manage your existing integrations and create new Zaps using the templates we've curated for you. It's a one-stop shop for all your integration needs!
Access your Zapier integrations from the DoiT Console
What’s next?
We're already working on additional integrations, unlocking countless new use cases by connecting DoiT’s product portfolio with applications you already use and love.
This is just another step we're taking to empower you to manage your resources more efficiently.The possibilities are endless with the integration of the DoiT Console and Zapier!
To get started, navigate to our Zapier Integrations page or the Zapier page in the DoiT Console to get a list of templates or select "DoiT" in your Zap’s trigger.
