One of the popular question I am getting often is “how do I break down my Google Cloud costs by location?”. Today, I am going to show how to make Iris and reOptimize — two open source projects by DoiT International, to collect and visualize this information for you.
Before we can actually get to specifics, let’s do a quick recap on Iris and reOptimize so people not familiar with these tools can be better equipped for the rest of the article.
Iris is an open source software which automatically assigns labels to Google Cloud resources, usually for better discoverability and observability. With Iris, each resource in Google Cloud gets an automatically generated labels, usually in a form of [iris_name], [iris_region] and [iris_zone]. For example, if you have a Google Compute Engine instance named `nginx`, Iris will automatically attach the following labels this instance [iris_name:nginx], [iris_region:us-central1] and [iris_zone:us-central1-f]. You can read more about how Iris works in one of our recent blog post.
Since Iris is open source and it is extensible using plugins, you can basically collect any information you’d like from Google Cloud and add it as labels to your resources. Few popular examples can be iris_instance-cores, iris_instance-memory and finally iris_ip.
reOptimize is a free cloud cost discovery and optimization platform which is also a part of Google’s Cloud Launcher. With reOptimize it’s easy to answer questions such as:
- What Google Cloud services I am paying for?
- How much I am going to spend on Google Cloud this month?
- How I can optimize my spend with Google Cloud?
One of the reOptimize’ most popular features is ability to produce custom reports. Reports are very similar to pivot tables which you are probably familiar with from working with spreadsheets such as Google Spreadsheets or Microsoft Excel.
Recently, reOptimize has introduced a “Cost Labels”, a convenient way to enrich reports with label information. If you label your resources with something like “env:production” or “app:backend”, you can filter or group your billing reports using these labels.
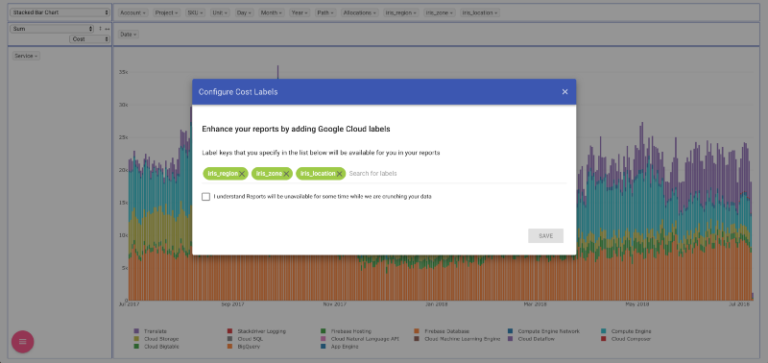
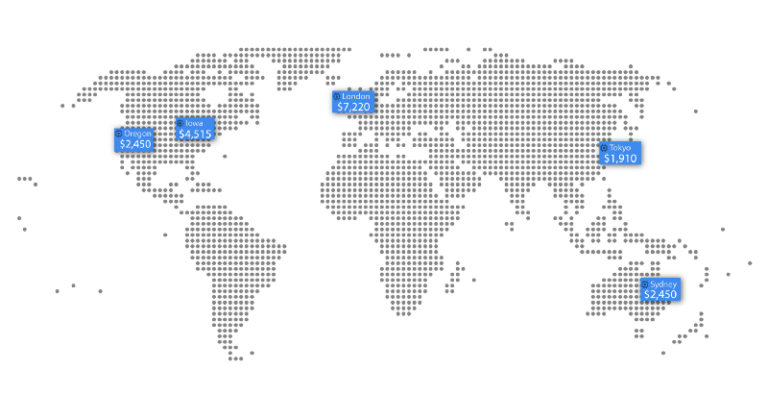
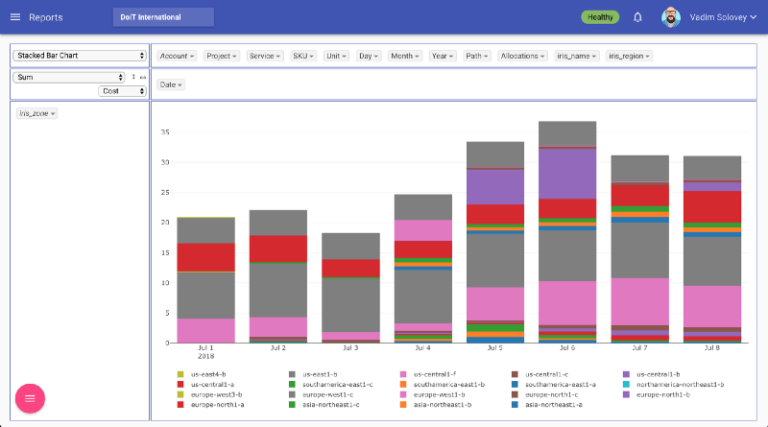
As you remember, Iris automatically adds to each resource the `iris_name`, `iris_region` and `iris_zone` labels. Once these labels are populated and propagated to Google’s billing data, you can configure these labels as “Cost Labels” and produce location aware reports:
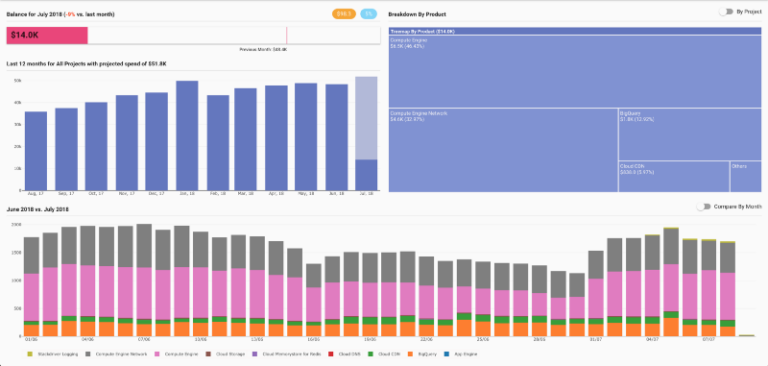
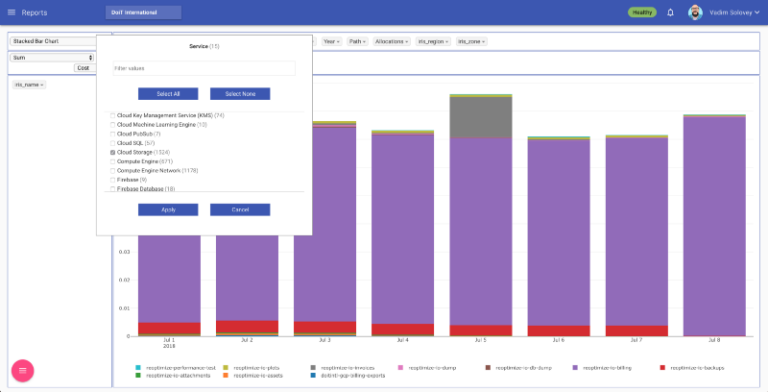
You can even track cost of individual instances, buckets or BigQuery datasets/tables using the iris_name label:
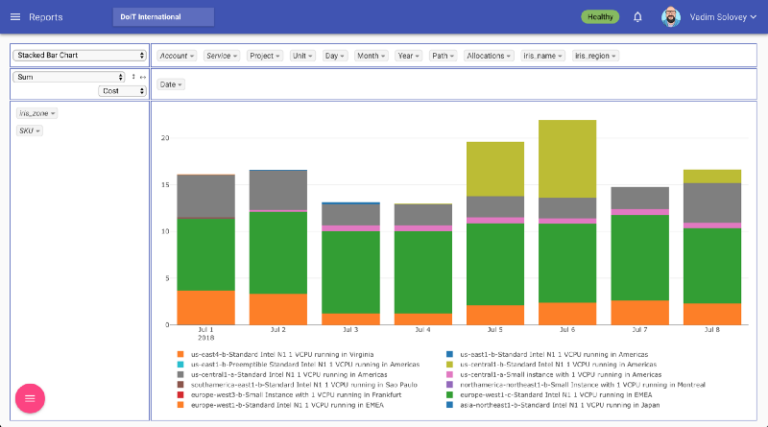
There is basically no limit in how you can analyze your Google Cloud costs. Another example can be break-down by zone and instance type over time:
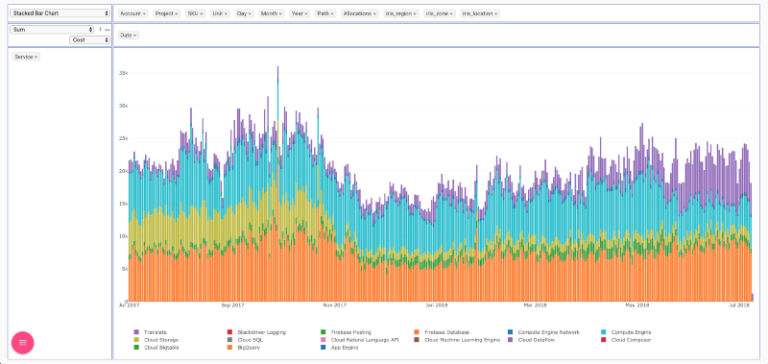
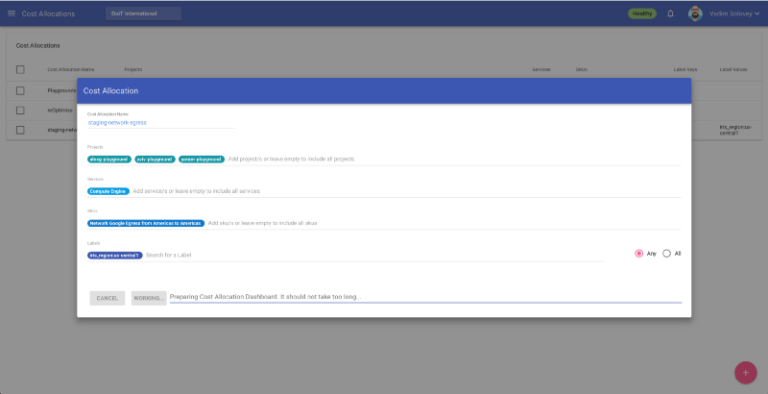
Cost Labels is the not the only great feature of reOptimize. You can create “Cost Allocations” which are intersections of Service, SKU, Project and Labels. With cost allocations it’s easy to track costs of your complete applications or services, environments and so on.
As great example is tracking network egress traffic using the following Cost Allocation:
Based on cost allocations, you can configure smart budgets or setup users with limited view to track only parts of your infrastructure.
We are actively looking for contributors to help us improve our open-source stack of tools for Google Cloud such as Shamash, Iris, Zorya, kubeIP and few others.
Want more stories? Check our blog, or follow Vadim on Twitter.