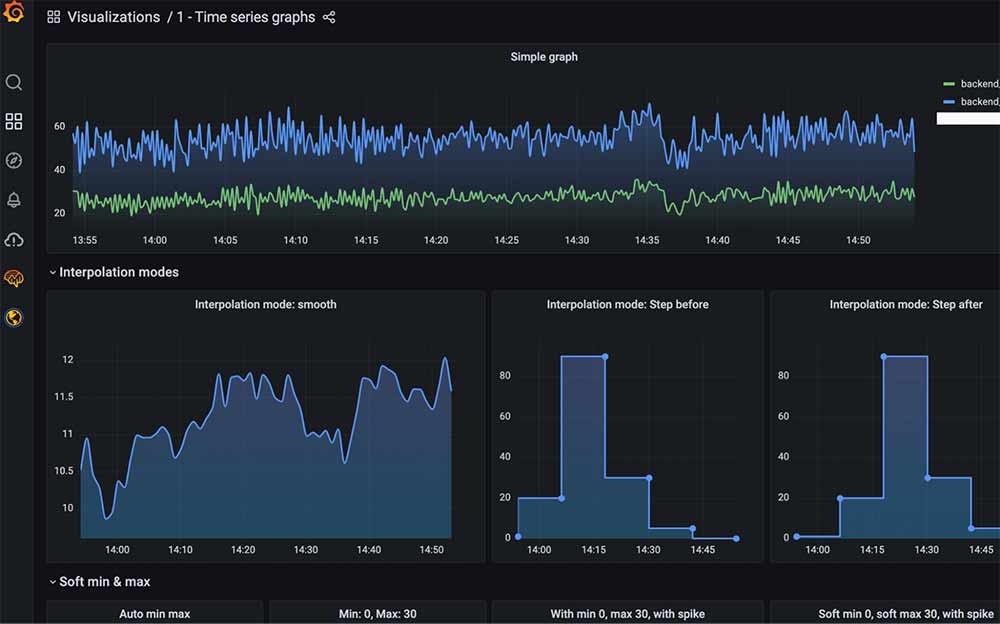
This approach means your dashboards will persist if you redeploy Grafana or deploy to another environment or cluster
Prometheus has become the de facto monitoring tool, which combines with Grafana and Alertmanager to create the complete observability and alerting stack for many organizations.
However, managing and deploying each of these components individually is a hassle and risks lack of synchronization between the components as infrastructure changes. WIth the addition of the kube-prometheus-stack Helm chart, managed by the prometheus-community, you can neatly keep the configuration for all three tools in one place with one Helm values file. This blog post looks at how we manage adding Grafana dashboards in the Helm chart, so that even if you redeploy Grafana or deploy to another environment/cluster, your dashboards will persist.
Prerequisites
First, we need to clone the repo containing the kube-prometheus-stack Helm chart as we cannot store our custom dashboards in code if we are pulling and applying the chart remotely; it is only possible to add them if we are applying the chart from a local copy of the code. We also need the following tools installed on our workstations:
- Git
- Helm
- Kubectl
- IDE of your choice
$ git clone https://github.com/prometheus-community/helm-charts.git
$ cd helm-charts/charts/kube-prometheus-stack
Once we are in the charts folder, we navigate to the Grafana dashboards folder, which containsall the stock dashboards that come out of the box.
$ cd templates/grafana/dashboards-1.14/
$ ls
alertmanager-overview.yaml	   grafana-overview.yaml
k8s-resources-pod.yaml		   namespace-by-workload.yaml
pod-total.yaml			   statefulset.yaml
apiserver.yaml			   k8s-coredns.yaml
k8s-resources-workload.yaml	   node-cluster-rsrc-use.yaml
As you can see, the grafana installation comes with many dashboards. They are applied from this dashboards directory by applying the configmaps templates contained within.
Exporting our custom dashboard
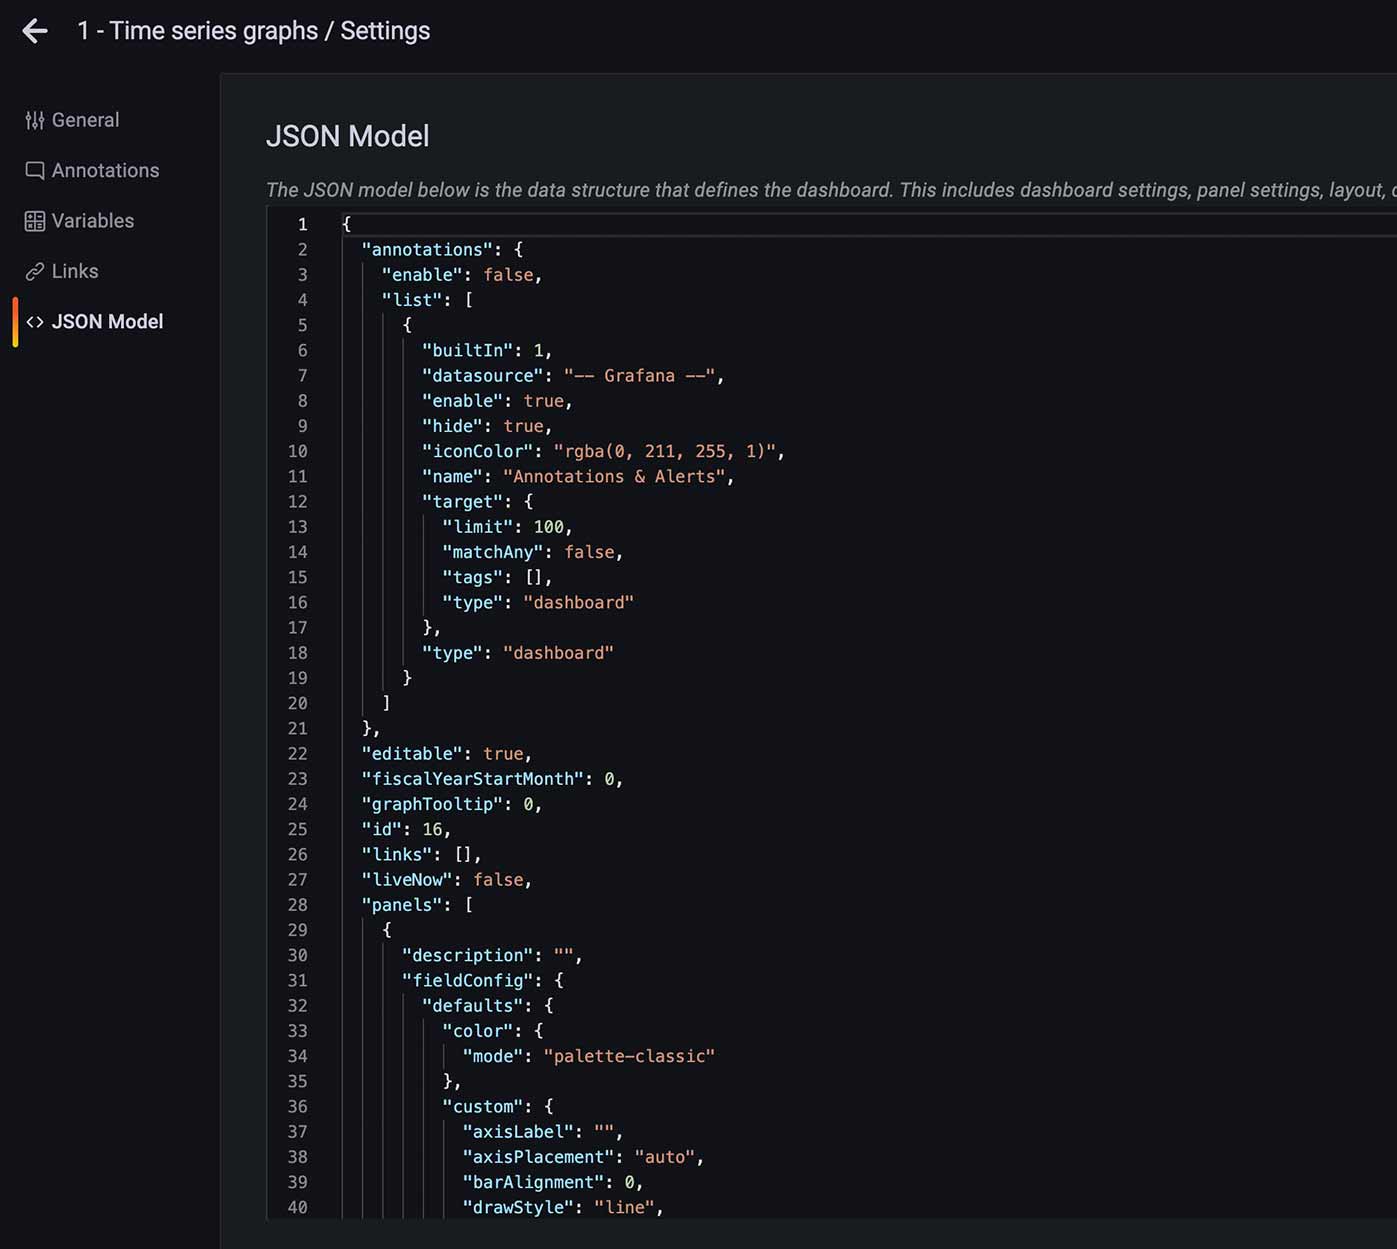
Once we have created a custom dashboard in Grafana and saved, we need an export of the json that we will be using to add to our configmap in the next step. Click on the setting cog on your dashboard and select the “JSON Model” on the left-hand pane. Here we can copy the json and save for later:

Adding our custom dashboard
Now we can add our own custom configmap Helm template to the dashboards folder. The easiest way is to duplicate one of the existing yaml files in that folder, rename it to the name of your dashboard and add the json to it. In my example, it will be “time-series-graph.yaml” after my custom dashboard above. Now we can start to amend the template. First, we remove the comment at the beginning of the file – this part:
{{- /*
Generated from 'alertmanager-overview' from https://raw.githubusercontent.com/prometheus-operator/kube-prometheus/main/manifests/grafana-dashboardDefinitions.yaml
Do not change in-place! In order to change this file first read following link:
https://github.com/prometheus-community/Helm-charts/tree/main/charts/kube-prometheus-stack/hack
*/ -}}
Next, we update the name of our ConfigMap in a couple of places – first here:
apiVersion: v1
kind: ConfigMap
metadata:
  namespace: {{ template "kube-prometheus-stack-grafana.namespace" . }}
  name: {{ printf "%s-%s" (include "kube-prometheus-stack.fullname" $) "alertmanager-overview" | trunc 63 | trimSuffix "-" }}
I will change “alertmanager-overview,” from which we copied the template originally, to “time-series-graphs” to match my dashboard and yaml file name:
apiVersion: v1
kind: ConfigMap
metadata:
  namespace: {{ template "kube-prometheus-stack-grafana.namespace" . }}
  name: {{ printf "%s-%s" (include "kube-prometheus-stack.fullname" $) "time-series-graph" | trunc 63 | trimSuffix "-" }}
Next, we change the name of the data section of the configmap template as below:
data:
  alertmanager-overview.json: |-
to
data:
  time-series-graph.json: |-
Then, we replace the JSON of the existing dashboard with the JSON we copied from the grafana dashboard settings directly under this line, as below, making sure to indent the entire json by 1 tab at least:
data:
  time-series-graphs.json: |-
    {
        "__inputs": [

        ],
        "__requires": [

        ],
        "annotations": {
            "list": [

            ]
        },
        "editable": false,
        "gnetId": null,
        "graphTooltip": 1,
        "hideControls": false,
        "id": null,
        "links": [

        ],
        "refresh": "30s",
        "rows": [
...
Generating rendered Helm templates
Now that we’ve added the dashboard confirmap Helm template yaml file, we check what yaml manifests are generated from the Helm chart to verify that the ConfigMap for our dashboard has been correctly generated:
# Add the repos to Helm for the charts we need
$ Helm repo add grafana https://grafana.github.io/Helm-charts

$ Helm repo add prometheus-community https://prometheus-community.github.io/Helm-charts


# Pull all the charts dependencies and update
$ Helm dependency build

$ Helm repo update
Now we can run the Helm template command to render the yaml manifests from our Helm templates and save to file to check later. We use the —validate flag as a way to check we have valid yaml Kubernetes manifests against the current context of the Kubernetes cluster:
$ Helm template kube-prometheus-stack . --validate > rendered-template.yaml
Next, we inspect the rendered-template.yaml file to verify our ConfigMap has been created and will be applied when we run the Helm install command in the next step:
$ cat rendered-template.yaml
…
---
# Source: kube-prometheus-stack/templates/grafana/dashboards-1.14/time-series-graphs.yaml
apiVersion: v1
kind: ConfigMap
metadata:
  namespace: default
  name: kube-prometheus-stack-time-series-graphs
  annotations:
    {}
  labels:
    grafana_dashboard: "1"
    app: kube-prometheus-stack-grafana
    app.kubernetes.io/managed-by: Helm
    app.kubernetes.io/instance: kube-prometheus-stack
    app.kubernetes.io/version: "32.2.1"
    app.kubernetes.io/part-of: kube-prometheus-stack
    chart: kube-prometheus-stack-32.2.1
    release: "kube-prometheus-stack"
    heritage: "Helm"
data:
  time-series-graphs.json: |-
    {
      "annotations": {
        "enable": false,
        "list": [
          {
            "builtIn": 1,
            "datasource": "-- Grafana --",
            "enable": true,
            "hide": true,
            "iconColor": "rgba(0, 211, 255, 1)",
            "name": "Annotations & Alerts",
A quick search for “time-series” in the file shows that our ConfigMap has been created and the data has the json of the dashboard we added earlier.
Lastly, we apply the Helm chart to our Kubernetes cluster and once Grafana is up, we can verify the dashboard exists:
$ Helm install kube-prometheus-stack .
