When critical production incidents occur, engineers often waste precious time navigating between an outdated infrastructure diagram and multiple cloud console tabs, frantically switching between different services they suspect might be causing the issue.
This situation plays out in companies every day, where cloud environments grow organically to the point that documentation can’t keep up. And as a result, SREs and InfoSec specialists are forced to spend time reconstructing context instead of solving the root cause of infrastructure issues. Meanwhile, your customers are impacted, revenue is lost, and the incident clock keeps ticking.
That’s why we’re excited to introduce Cloud Diagrams. Born from our recent acquisition of LiveDiagrams, Cloud Diagrams gives SRE and security teams a near-real time picture of their AWS architecture — with support for additional platforms to follow — so they can resolve issues at their source while enabling context-rich architecture discussions that lead to better decisions.
With an always-current visual of your infrastructure, teams can quickly identify not just what's failing, but why it's failing by tracing issues through their dependencies, cutting resolution time from hours to minutes.
Let's explore the growing complexity of cloud environments, the challenges this creates, and how Cloud Diagrams provides the visibility teams need.
Want to explore Cloud Diagrams yourself? Click below to take a self-guided, interactive demo.
The growing complexity of cloud environments
Teams build applications over time, but when it's time to revisit architecture decisions or troubleshoot an incident, the original context and reasoning are often forgotten or lost.
Maybe the decision maker(s) are no longer with the company. Perhaps the major deployments that changed everything were never documented. Either way, you’re left with cloud environments that have grown far beyond what anyone can keep in their head.
This creates three challenges that impact companies daily:
#1 - Invisible interdependencies
Existing tooling may give you the raw data, but miss the story your infrastructure is telling.
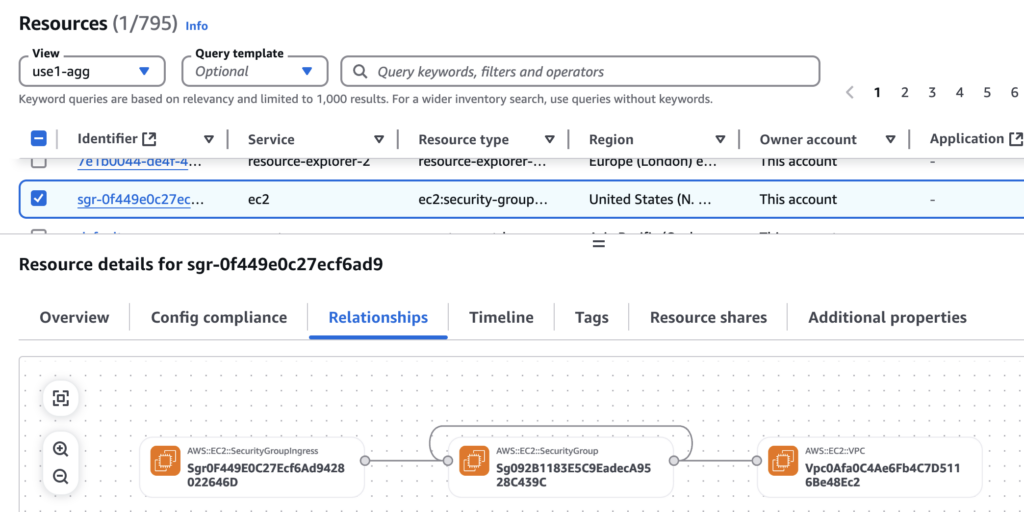
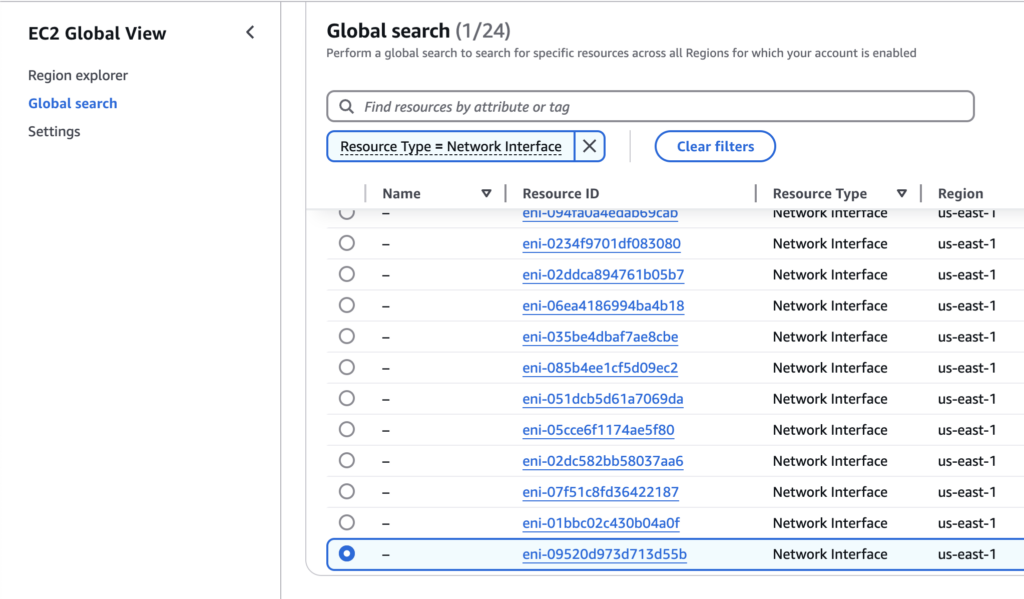
Tools such as AWS Resource Explorer overwhelm you with thousands of lines of the resources — including ones automatically provisioned by AWS — without providing a truly linked view of deployed components. For instance, in the example below, you can’t see if there are any resources in the subnet.
EC2 Global View counts your instances and shows you where they are, but can’t explain how they work together, what’s around them, and how they are linked to load balancers, EKS clusters, etc.
This forces you and your team to play detective, untangling connections between services with little context for why they were built that way.
Meanwhile, cloud resources within those services have even more complicated relationships.
Instances run in subnets, which live in VPCs, which may be connected to other VPCs, with security groups governing them all. Load balancers, API gateways, Lambda functions, containers, databases, and S3 buckets have their own properties and dependencies that are necessary for a service to function.
Without visibility into these connections, teams operate with a fragmented understanding, even missing critical relationships even within systems they directly manage. As a result engineers make changes based on incomplete pictures, crossing their fingers that nothing important breaks downstream.
#2 - Outdated documentation
That detailed architecture diagram you and your team drew up? It became outdated the moment a new resource was added.
Architecture diagrams are mostly static and not updated as frequently as they should be. After all, who has time to update architecture diagrams after every deployment or configuration change?
As a result, teams rely on institutional memory as their unofficial documentation strategy.
This approach works just fine — until the lead architect goes on vacation or leaves the company and suddenly, critical context disappears overnight.
#3 - Extended time-to-resolution
Infrastructure visibility gaps create costly business problems, not just technical headaches.
Without clear architecture visibility, troubleshooting becomes a complex puzzle. Engineers waste valuable time manually tracing connections between services, cross-referencing multiple logs, and piecing together resource relationships from memory.
Is that latency from an overloaded database? A network misconfiguration? Or a resource limitation hidden in the dependency chain?
This detective work diverts time from implementing solutions, extends incident resolution, and directly impacts your customers and bottom line.
Cloud Diagrams addresses these challenges head-on by providing the clear, comprehensive visibility into your infrastructure that teams need to operate efficiently. Let’s explore how it helps teams quickly visualize and troubleshoot infrastructure issues.
How Cloud Diagrams provides complete visibility into your infrastructure
Cloud Diagrams offers two main views to help you understand your infrastructure:
- Account diagram: Cloud Diagrams creates one diagram for every connected AWS account, allowing you to visualize and analyze your resources and understand the relationships between them.
- Network flow: Network flow displays your entire cloud networking topology across all connected accounts in a single consolidated view.
To visualize your AWS accounts, you will need to grant read-only permissions across networking, compute, storage, and security services in that account. This will allow Cloud Diagrams to map your network topology, container services, storage systems, security configurations, and service connections within that account.
Visualizing your AWS account infrastructure
After connecting an AWS account, Cloud Diagrams will create a comprehensive, real-time map of your AWS account’s current infrastructure, including resources, services, and their connections.
Your diagram will automatically update as resources get added, modified, or deleted.
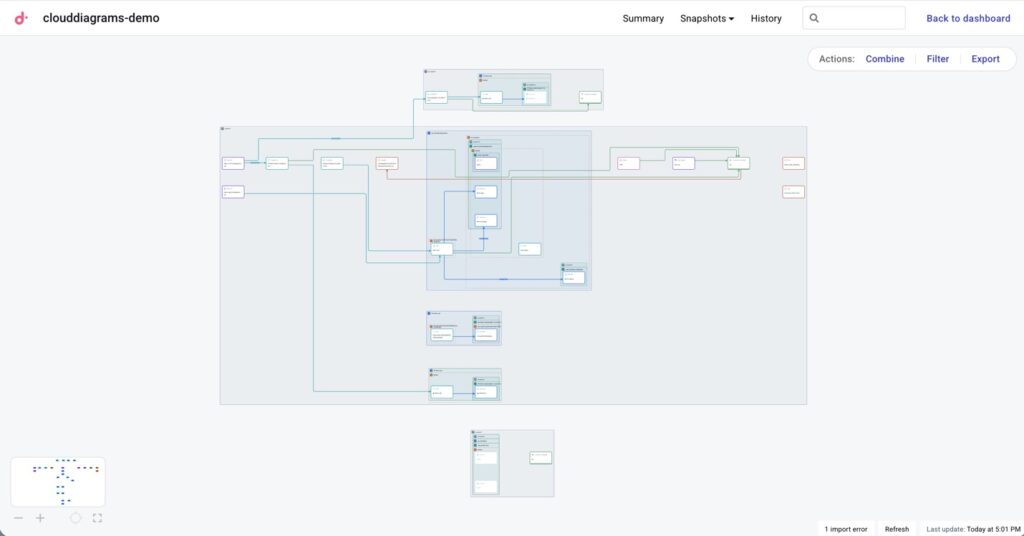
Infrastructure mapping of an AWS account in Cloud Diagrams
This makes it easier to understand service relationships and detect architectural inconsistencies that might otherwise remain hidden.
The diagram follows the natural flow of network data from left to right: From public-facing resources like Route 53 and load balancers, through networking layers, and into private resources such as internal S3 buckets and database services.
Navigating your AWS account's infrastructure and connections in Cloud Diagrams
Clicking on any service instance will highlight other instances it is connected to, and display additional properties and information on that resource.
For example, we can see below the ALB's configuration details, network settings, and security rules. Additionally, connected services are highlighted and unrelated resources are faded out, making it easy to visualize traffic flow and dependencies.
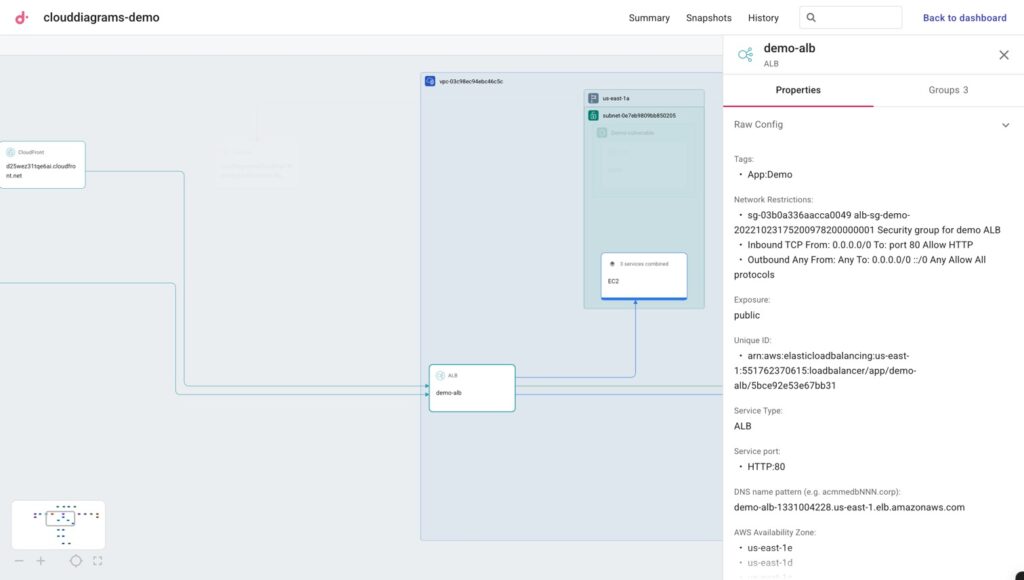
Properties of an Application Load Balancer (ALB) in Cloud Diagrams
This visibility helps you instantly spot critical issues that would otherwise require a lengthier investigation.
For example, we can see that this orphaned network load balancer has nothing connected to it, yet we're still paying for it every month.
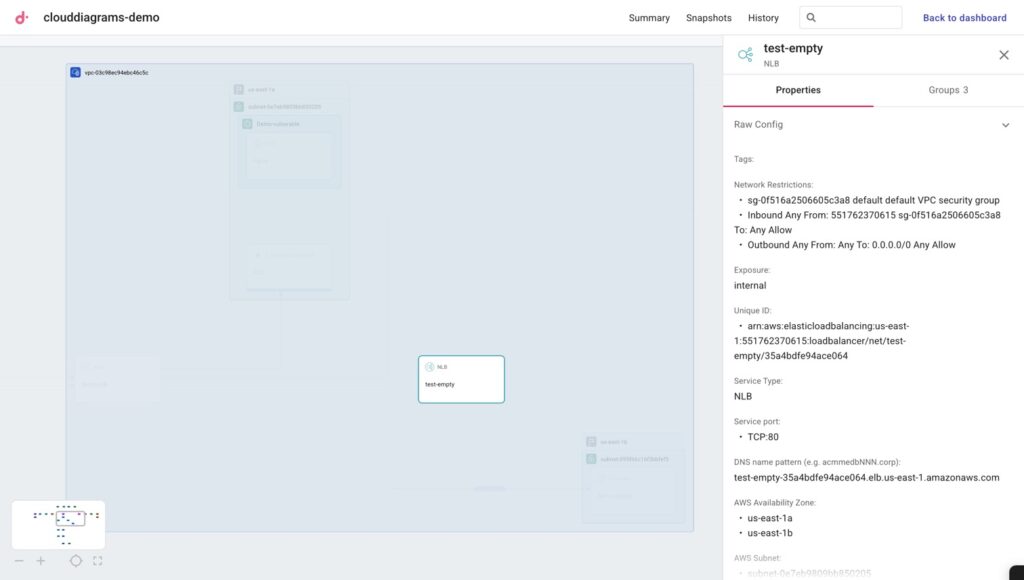
Orphaned Network Load Balancer (NLB) identified in Cloud Diagrams
We can also spot inconsistent routing architecture that can indicate potential security vulnerabilities.
Notice how the first route goes through CloudFront with its built-in WAF capabilities, while the second one bypasses it and connects directly to a load balancer.
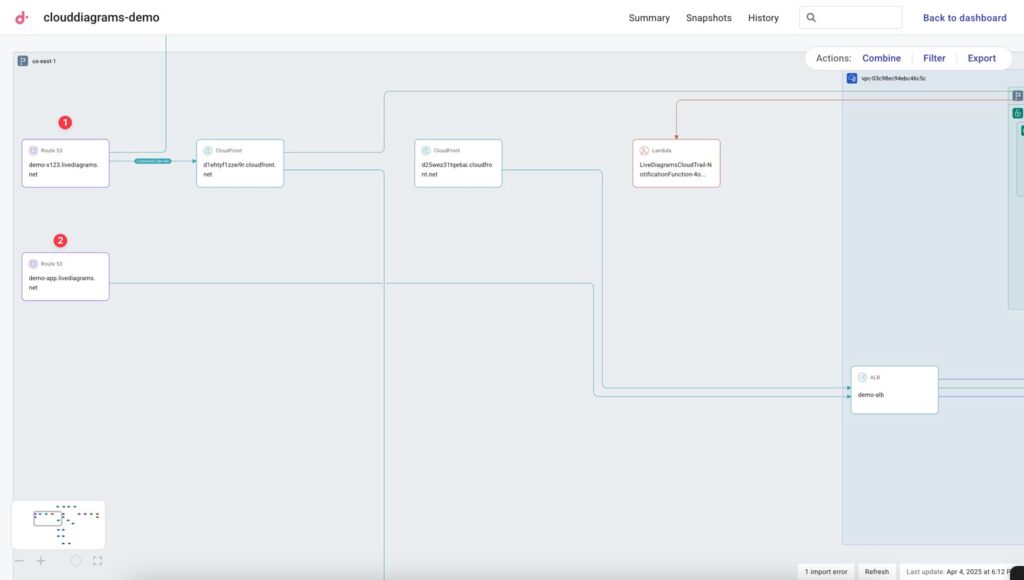
Identifying a Route 53 route that doesn't pass through CloudFront before communicating with an Application Load Balancer
Isolating cloud resources for targeted troubleshooting
When troubleshooting incidents in complex environments, navigating through numerous services and connections can be overwhelming.
Instead, we can use Filter to visually isolate resources we want to focus on.
Let's say you know a cost spike or performance issue is EC2-related, and want to isolate EC2 instances and their connections to make investigation easier. You can filter for EC2 resources, and even filter further for service resources with specific tag key-value pairs.
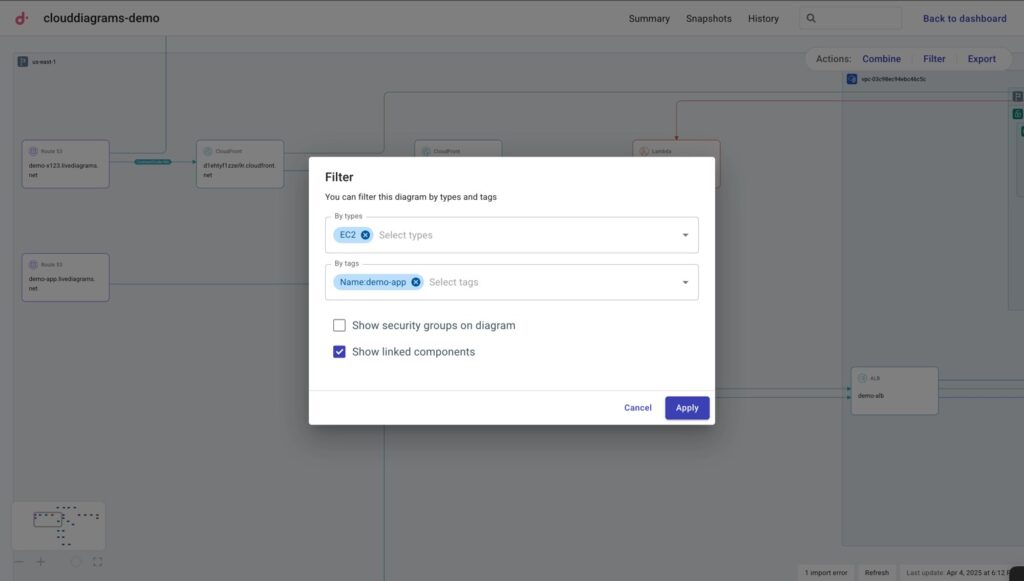
Filtering for only EC2 resources and their connections in Cloud Diagrams
This will transform your diagram into a targeted view of only EC2 instances with a specific key-value pair, and any relevant connected components, making it easier to trace dependencies and identify the root cause of incidents.
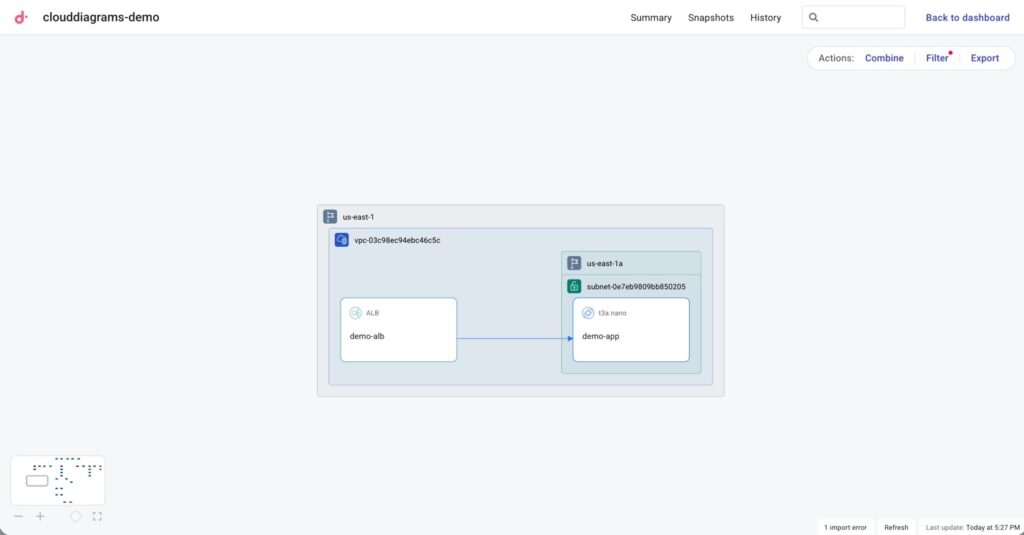
Filtered view of EC2 resources with a specific key:value pair and their connections Cloud Diagrams
Grouping similar resources for better visualization
Larger cloud environments can quickly become visually overwhelming with dozens of individual resources — like the S3 buckets below — making it difficult to focus on what matters. And from speaking with customers, oftentimes the problem with existing diagramming tools is that there is too much to look at.
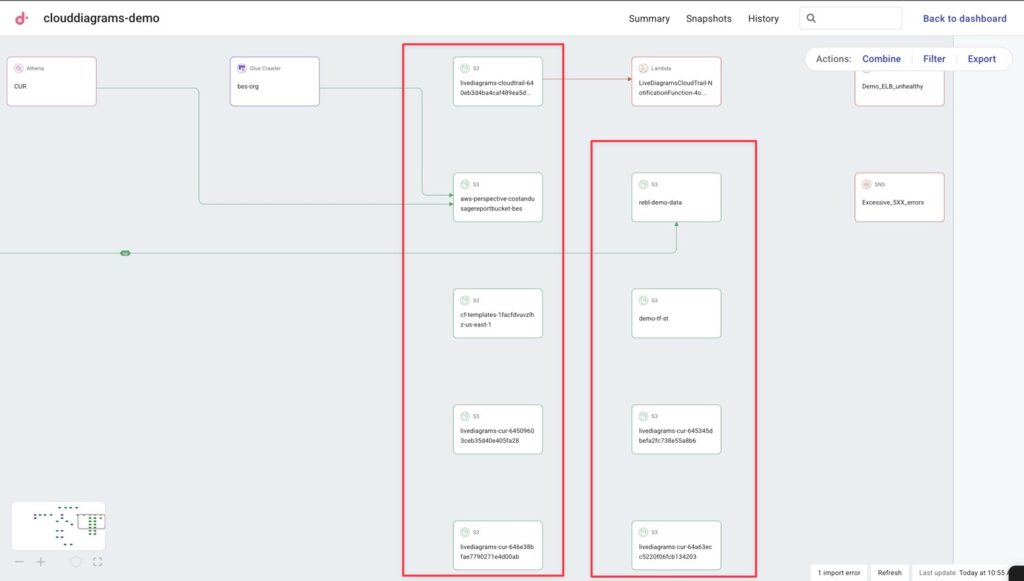
Multiple S3 buckets shown the infrastructure view in Cloud Diagrams
Cloud Diagrams’ Combine feature helps you consolidate similar resources into logical groups for clearer visualization.
And just like with Filter, you can combine based on service and/or specific key:value pairs.
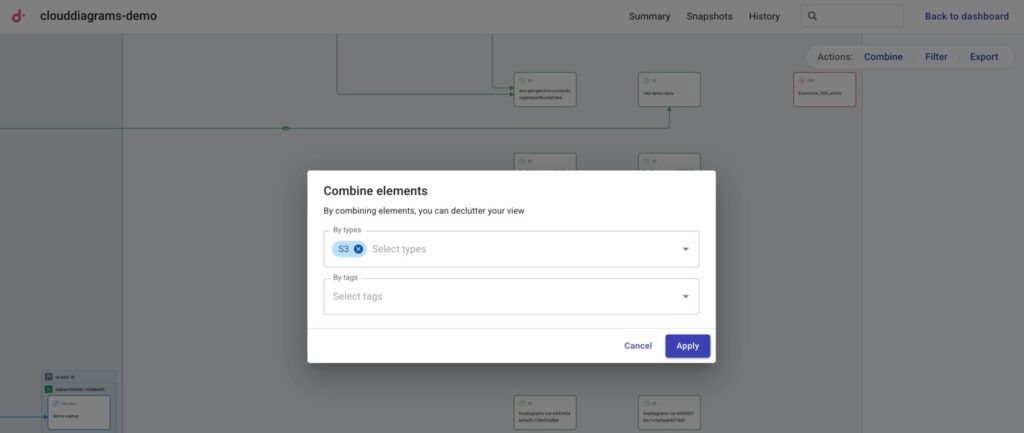
Combining S3 resources together to declutter our infrastructure view in Cloud Diagrams
Cloud Diagrams’ Combine feature helps you consolidate similar resources into logical groups for clearer visualization. And just like with Filter, you can combine based on service and/or specific key:value pairs.
As you can see, we've combined 14 S3 buckets into a single node, dramatically simplifying our diagram.
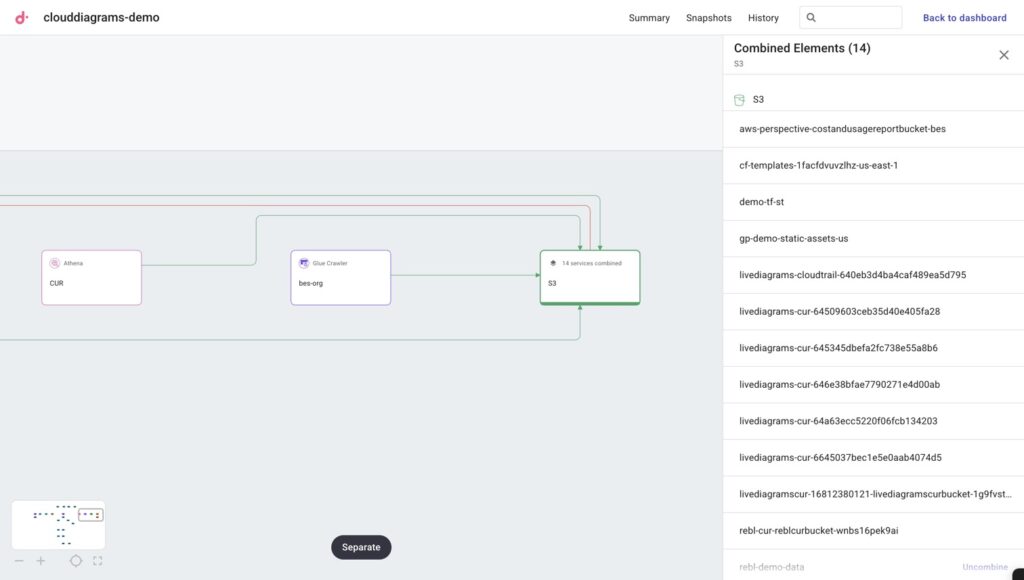
14 S3 buckets combined into a single node, decluttering our infrastructure diagram
Infrastructure version history and snapshots
Beyond just visualizing your current state, Cloud Diagrams tracks the evolution of your AWS account’s infrastructure over time.
Clicking on History shows a chronological audit trail showing exactly what was created, modified, or deleted in your environment, which you can compare to previous infrastructure snapshots.
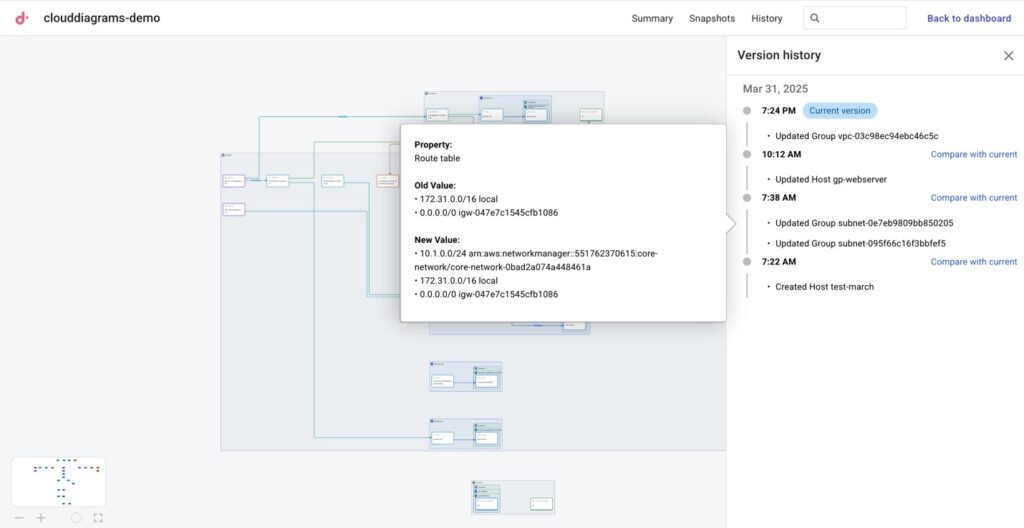
AWS account infrastructure version history in Cloud Diagrams
If you want a more specific before/after comparison, Snapshots lets you create customized comparison views filtered by service type, AWS account, or other dimensions.
This makes it easy to isolate and understand changes to specific parts of your architecture. For example, in the snapshot comparison below, you can see the web server instance transition from stopped to running, acquiring a public IP address and showing associated security configuration changes.
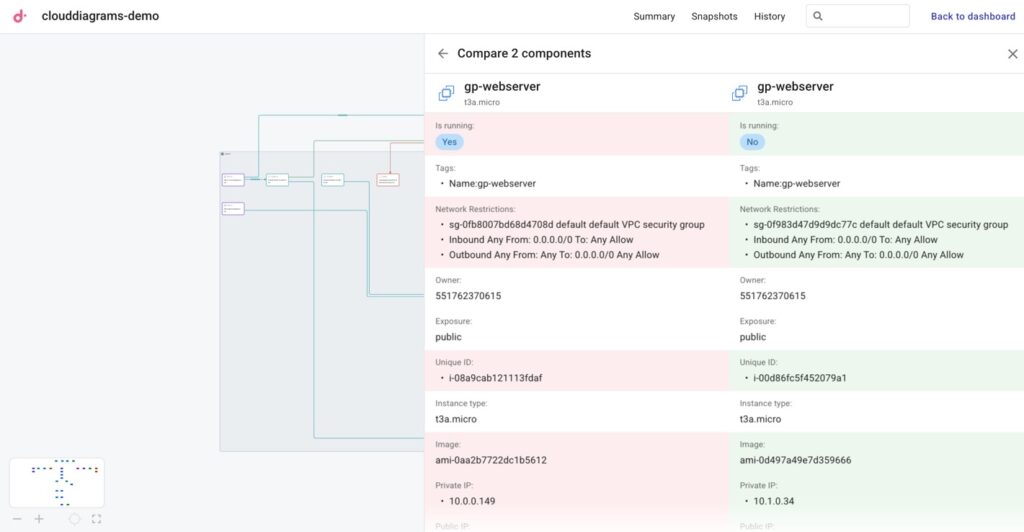
Tracking changes in an EC2 instance that is part of our AWS Account's Cloud Diagram.
Network Layer: Troubleshoot network issues in minutes
While individual account diagrams provide valuable context into your resources, you may face connectivity challenges that span multiple VPCs, regions, and even AWS accounts.
This is where the Network layer view in Cloud Diagrams shines.
The Network layer gives you a global visual of your cloud networking infrastructure across all connected accounts. It helps you understand network flows between subnets in different VPCs, regions, and accounts — essentially creating a comprehensive map of your networking topology.
A clear view of your network architecture
The Network layer organizes resources by account — displayed as vertical columns — and regions — displayed as horizontal sections within each account — making it immediately obvious how your network components relate to each other across your entire infrastructure.
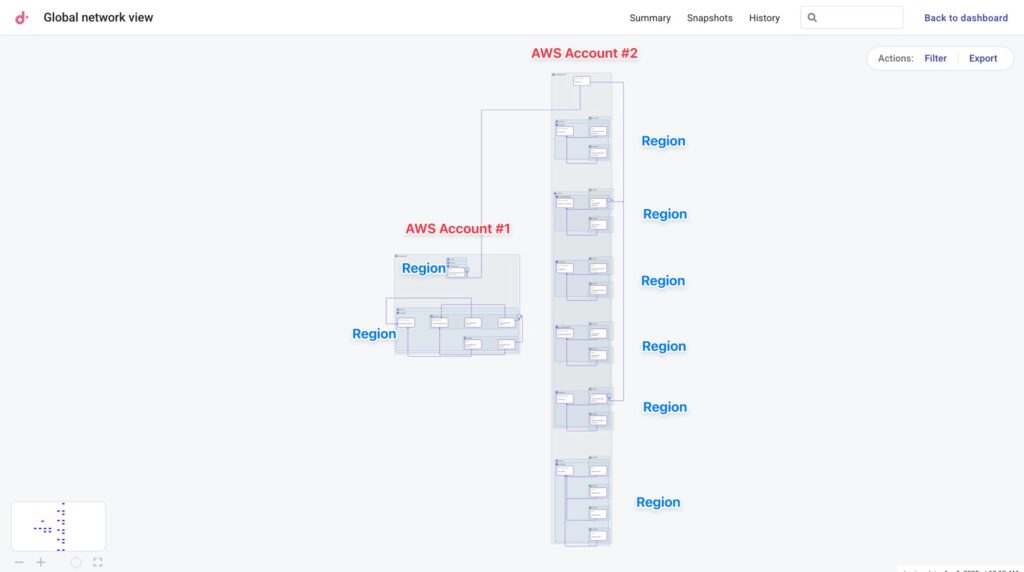
Network layer view of AWS accounts connected to Cloud Diagrams and how their network components connect to each other
Using this view, you can:
- Map network connections across your environment by visualizing CloudWAN, TransitVPC, and VPN networks spanning different accounts and hybrid cloud setups.
- Get an inventory of NAT and internet gateways by seeing all these components in one consolidated view.
- Troubleshoot routing issues by verifying that routing tables are correctly configured across your network, allowing you to identify misconfigurations before they cause service disruptions.
Real-world example: Fixing cross-VPC communication issues
Imagine that two of your applications in different VPCs can't communicate despite having security groups properly configured.
With traditional tools, you would spend hours navigating through multiple AWS console screens, checking subnet configurations, and comparing routing tables. With Cloud Diagrams, resolving this is much easier.
The Network Layer immediately shows your Core Network with connections to three VPC subnets across our two AWS accounts.
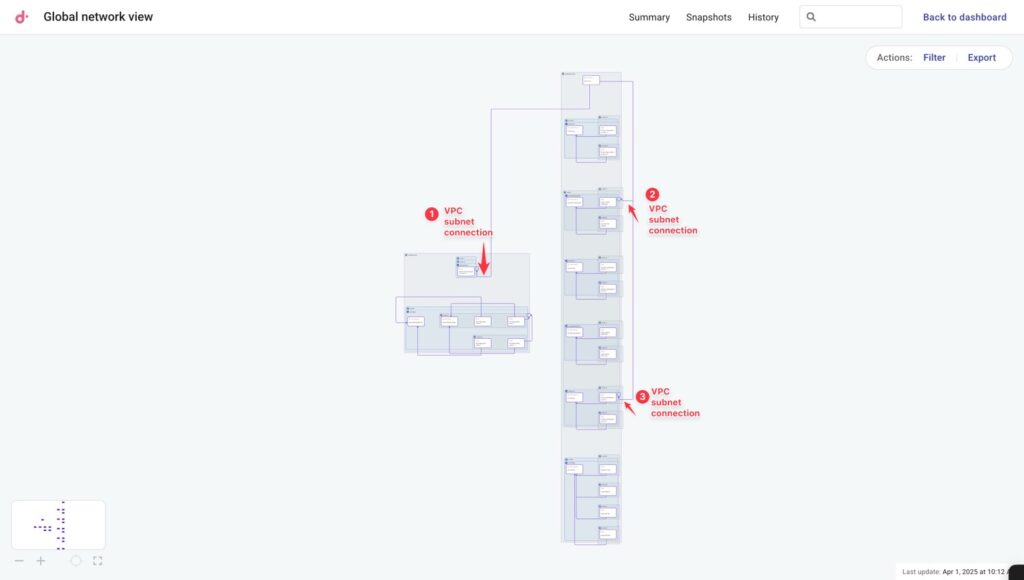
Three VPC subnets identified in the Network layer view of Cloud Diagrams
Following the first connection to our first AWS Account, you'll see a subnet with its routing table properly configured to point to the Network Manager Core Network.
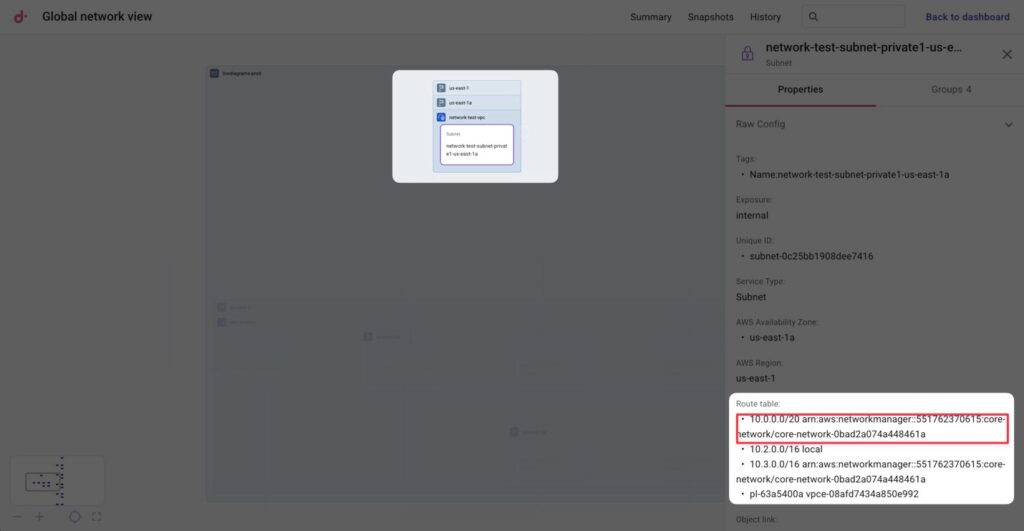
VPC Subnet properly configured to the Network Manager Core Network
But when you check the second subnet of the second AWS account, you quickly discover it's missing the essential route entry needed for return traffic.
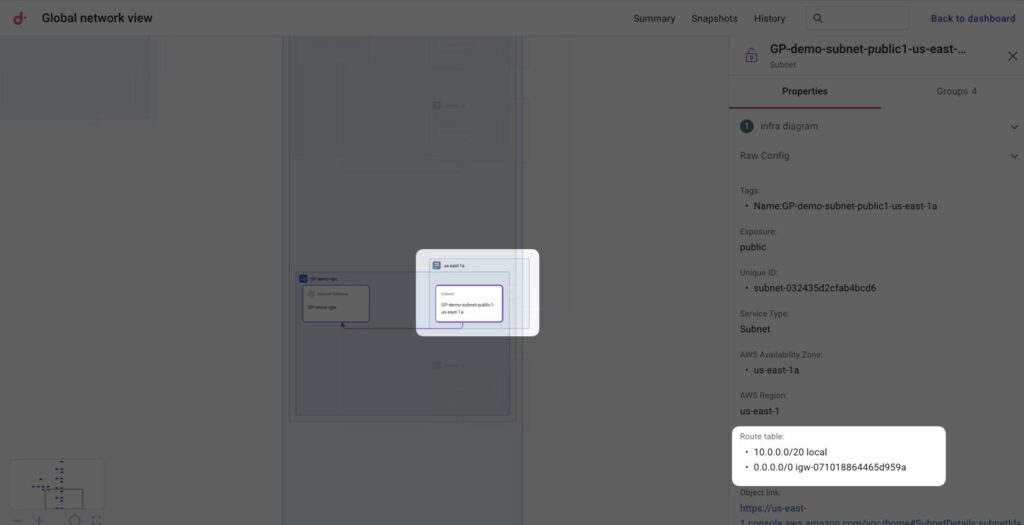
VPC Subnet missing a route entry to Network Manager Core Network
With the issue identified, you can use the direct link to the AWS console to add the missing route.
Breaking knowledge silos between teams
Cloud Diagrams extends far beyond incident response — it’s also a great tool for getting teams on the same page.
We've heard from teams whose engineers felt hesitant to explore services they don't directly manage.
Cloud Diagrams helps by giving them an easy visual way to explore unfamiliar territory because unlike traditional documentation options that are either too high-level or overwhelmingly detailed, Cloud Diagrams sits in the perfect middle ground, allowing teams to zoom in or out based on their needs.
Additionally, companies have described to us how their meticulous Confluence documentation or LucidChart/Vizio/Gliffy diagrams became obsolete almost immediately after creation due to the rapid evolution of their infrastructure.
With Cloud Diagrams' always-current visualizations, teams can now have context-rich discussions when making architectural decisions, without wasting time manually maintaining diagrams.
What’s next for Cloud Diagrams?
As we continue to develop Cloud Diagrams, we're excited about expanding its capabilities to deliver even more value, transforming it into an even more powerful tool for making informed technical and financial decisions about your cloud environment.
Some updates to look forward to:
- Visualizing cost data directly on your diagram resources, allowing you to see not just how your cloud infrastructure is built, but how much each component contributes to its overall cost.
- Support for additional cloud platforms including Google Cloud, enabling true multicloud visibility from a single interface.
- Enhanced integrations with other DoiT Cloud Intelligence features like Anomaly Detection so, for example, when you receive a cost spike alert, you can immediately visualize the resource and its dependencies to quickly identify the root cause.
- Finally, we're also working on integrations with third-party tools like Wiz to enrich your diagrams with security events and other operational data.
Want to see Cloud Diagrams in action? Check out our step-by-step walkthrough, or contact a DoiT expert today to learn how you can start visualizing your AWS infrastructure.
Cloud Diagrams is available for all the customers on the DoiT Cloud Intelligence Enhanced or Enterprise tiers, as well as on the DoiT Cloud Navigator Enhanced, Premium or Enterprise tiers.