If you are streaming data to AWS IoT Core, properly storing and visualizing that data are critical downstream components to architect well in advance to support big data-scale analytics.
Continuing from my previous discussion on how to securely onboard a production-scale fleet of IoT devices into the AWS IoT Registry and stream data to IoT Core, this follow-up article will cover various AWS serverless services you should employ to securely store and manipulate that data once it has hit the AWS platform.

Overview
This discussion is broken up into the following sections:
- Storage of streaming data
- Visualization of streaming data
Unlike part one, what will be discussed here can be performed through the AWS web console, so no programming experience is required.
The following AWS services will be covered: IoT Core Rules, IoT Analytics, DynamoDB, and Quicksight.
Storage of streaming data
Successful IoT onboard check
If you have successfully onboarded devices into the IoT registry and begun streaming data to the IoT core, you should see a steady stream of messages arriving from the AWS IoT main dashboard:

The temperature streaming script I provided in part one sends temperature readings to IoT Core every 5 seconds. I have registered three Raspberry Pi devices in my home — one in the upstairs loft, one in the ground floor living room, and one in a downstairs bedroom — and so I expect to see the 51,840 published messages per day shown above (17,280 messages per device).
The IoT web console makes forwarding these messages to various AWS services for processing and storage a breeze. Regardless of the destination service, sending IoT data to another AWS service is as simple as creating an IoT Rule in the web console. Let’s walk through how to do this by setting up a simple DynamoDB table and sending all streaming data to it.
Stream to DynamoDB
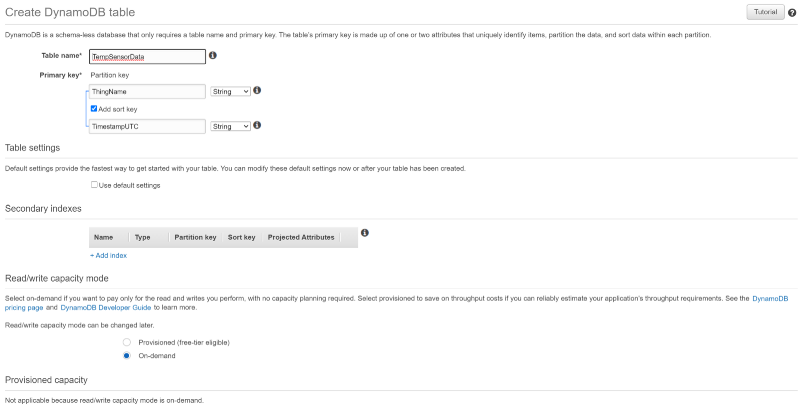
Create a DynamoDB table named “TempSensorData”, with a Partition key of “ThingName” and a sort key of “TimestampUTC”, matching the primary key values streaming up to IoT Core. Set the table to utilize “On-demand” capacity rather than provisioned to save money during our small test example. That’s it! When we set up an IoT Rule that forwards data to this table, the rule will identify non-key fields in our data and populate them into the table:
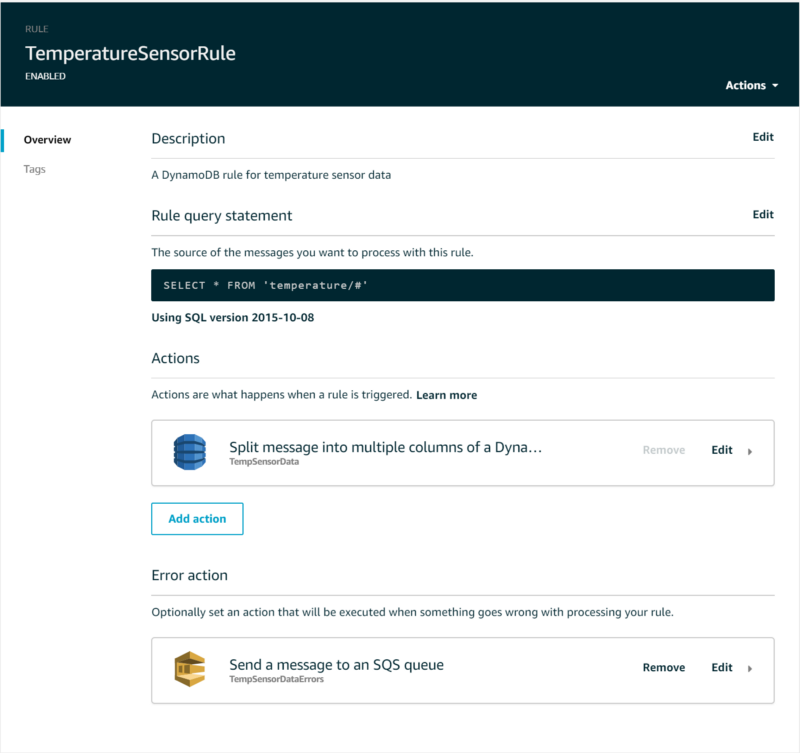
Once the table has successfully provisioned, head back over to the IoT Core platform and navigates to Act → Rules, then create a new rule. Name this new rule “TemperatureSensorRule”, provide a description, and set the Rule query statement to select all values streamed to the high-level ‘temperature’ topic.
How can we create a rule that captures all temperature values when each device streams to its own device-unique topic? This can be accomplished with IoT SQL wildcards. Recall that each device streams to a topic defined by three devicy policy variables that, collectively, create a device-unique topic:
temperature/${iot:Connection.Thing.Attributes[BuildingName]}/${iot:Connection.Thing.Attributes[Location]}/${iot:Connection.Thing.ThingName}
For example, these are the topics the three devices in my home publish to:
temperature/house417/loft/sensor_7210b5ba84f64cbbb406e98a1c3b3d32
temperature/house417/living_room/sensor_d51ea63b02bf4cb5b8ac9cf9b464ec3a
temperature/house417/downstairs_bedroom/sensor_b912a3f3c85f4b44ba60720ee43a1a94
The IoT topic to select in your IoT SQL rule will be temperature/# given that the # wildcard matches one or more subpaths. The IoT SQL statement to use is therefore the following:
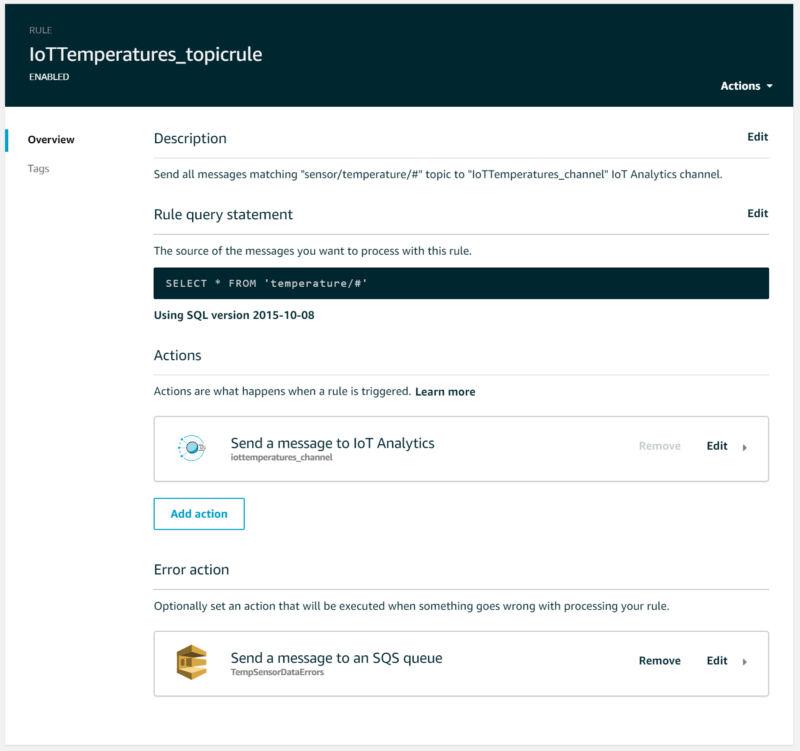
SELECT * FROM ‘temperature/#’
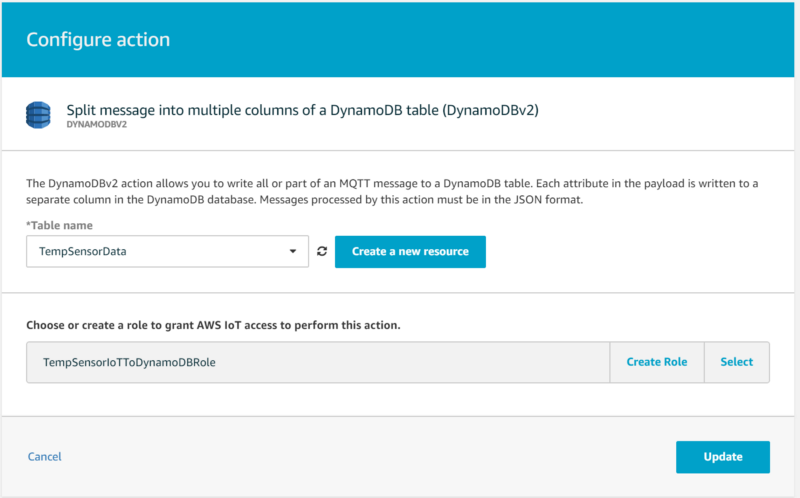
From here, click “Add action” and select the option that sends data into a DynamoDB table. Be careful; make sure to select the ‘DynamoDBv2" option, as the v1 option will not auto-populate non-key fields, instead storing the full message in the table as a single JSON-as-string field:

From here, select your DynamoDB table to stream data into and allow the wizard to create a role granting AWS IoT permissions to send IoT data into the DynamoDB table:
Once the IoT Core Rule has created, you can optionally add an Error action that sends failed message deliveries to, for example, an SQS dead letter queue or an S3 bucket. Your IoT Rule should look like the following once complete:
After a few seconds you will see the table populated with data:
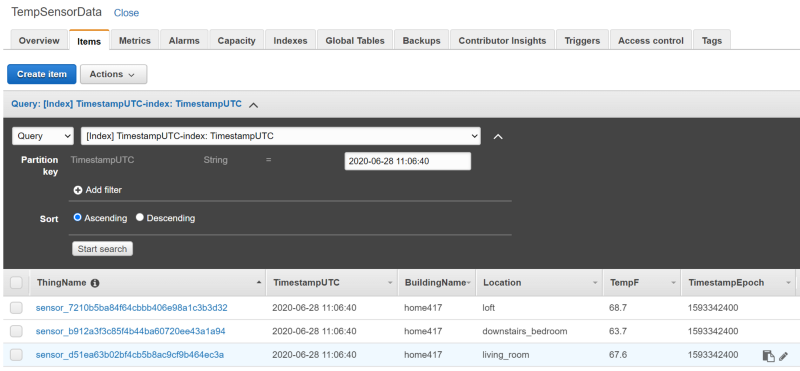
From here, you could build custom analytics and visualization applications that pull data from DynamoDB. More realistically in a production setting (and too costly for the purposes of a demo walkthrough), you could forward IoT data to a Kinesis Firehose data stream instead of DynamoDB. This Firehose stream would then batch write to a data warehouse such as Redshift and/or an object store such as S3, with the Firehose batch write critical to help prevent individual writes from production-scale IoT streaming data from causing Redshift performance issues or hitting S3 write throughput limits. Redshift, DynamoDB, and S3 are all great sources for big-data scale analytics applications.
For example, you could build out an Apache Spark on AWS EMR job or a machine learning model running on AWS Sagemaker and have either one of those services pull from DynamoDB, Redshift, or S3.
However, in this article, I would like to focus on a purely serverless approach to storage and visualization where no coding is required. With that in mind, let’s dive into how we can, in a serverless fashion, store our raw data and filtered datasets with lifecycle policies using the IoT Analytics time-series datastore, then use Quicksight to perform visualization. Since Quicksight cannot pull from DynamoDB, Redshift as a source is a bit pricey for the purposes of a demo, and IoT Analytics can easily accomplish our requirements for serverless high-throughput data storage and retrieval by QuickSight, we will move forward with IoT Analytics as the data store of choice.
Stream to IoT Analytics
Navigate to the IoT Analytics service and use the Quick Create wizard to engage in a 1-click creation process for streaming data into IoT Analytics from our IoT Core temperature topic. This process will create:
- A channel where raw IoT data will arrive from IoT Core, as well as the IoT Core Rule that moves data into this channel
- A pipeline where channel data can be optionally filtered and transformed
- A data store for pipeline-output data with an associated retention period
- A filtered dataset from the data store with its own retention period and periodic re-creation schedule. The filtered dataset is what Quicksight will use to create its insights and visualizations.
Setting up all these IoT Analytics components is as simple as filling in the following two Quick Start fields:
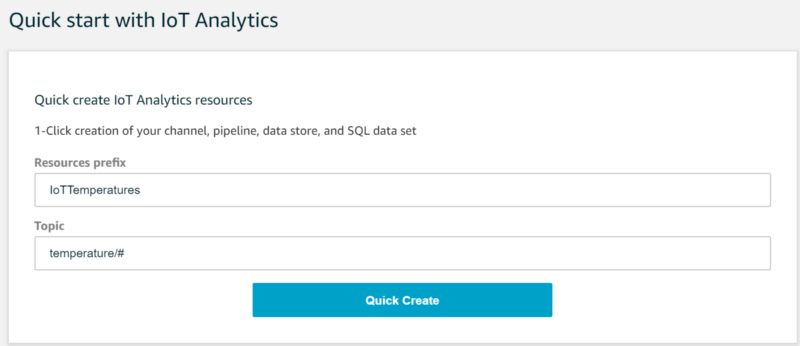
The wizard will then create the required Channel, Pipeline, Data Store, and Data Set entries. What these IoT Analytics components do and what the wizard engages in is not transparent, so let’s walk through the details.
An IoT Analytics Channel is where streaming data arrives. If you navigate back to the IoT Core Rules list, you will notice that the wizard has created a rule identical to the DynamoDB rule you set up earlier, except that the Action being taken now forwards data to the channel the wizard just created in the IoT Analytics platform. Note that if you want erroneous message deliveries to be captured, you will need to update the rule to specify a destination such as an SQS queue:
An IoT Analytics Pipeline allows you to optionally enrich, transform, and filter messages based on their attributes. Manipulation of raw data isn’t required for our example, so we will leave the Pipeline defaults as-is.
IoT Data stores are where streaming data is stored, either indefinitely or for a specified period of time. Behind the scenes this data is being stored in an AWS-managed S3 bucket, so you continue to benefit from that service’s 11 9’s of durability and 99.99% high availability. If desired, a data store can be configured to save data to an S3 bucket you control to make grabbing and working with IoT data easier for services that might not integrate as well with IoT Analytics, but for the purposes of this demo we will stay with the hidden service-managed bucket.
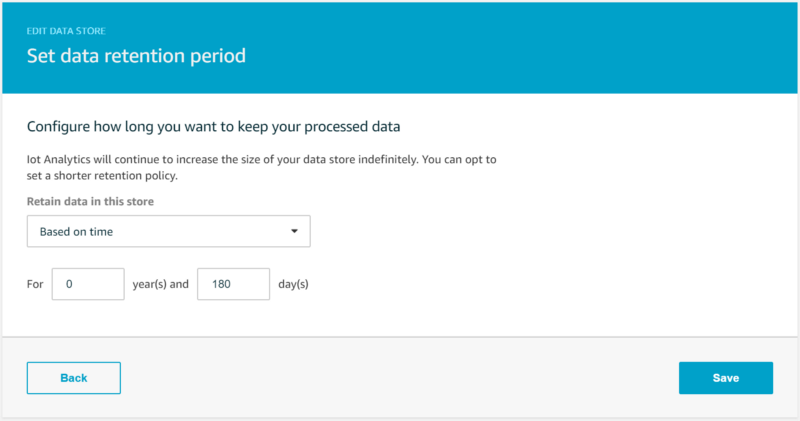
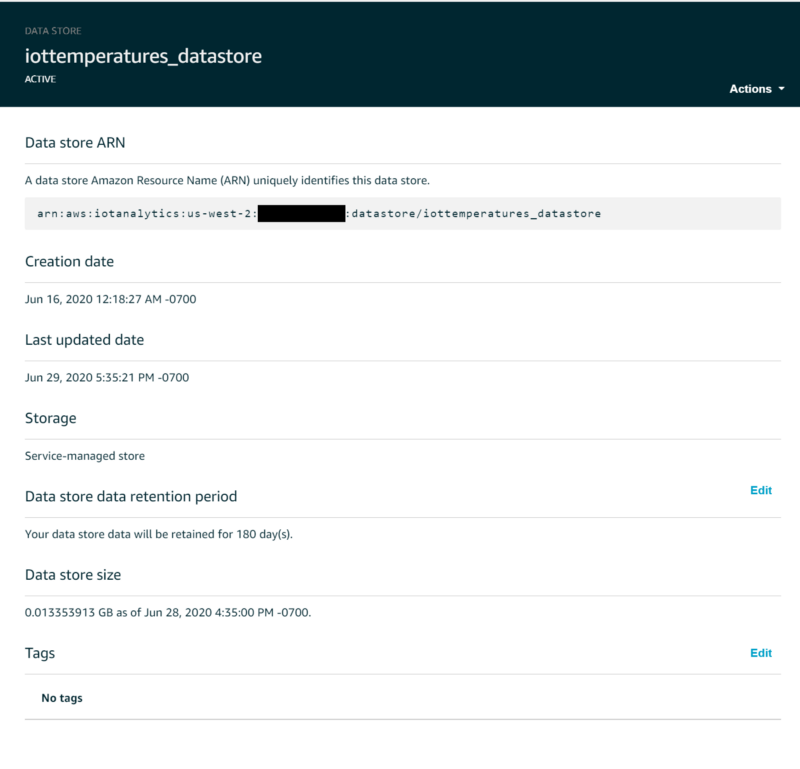
By default, data streamed into an IoT Analytics data store will be retained indefinitely, however changing this can be performed in the web console by clicking on “Edit” next to “Data store data retention period”. To keep production-scale IoT costs down, you should expire Data Store data after a certain period of time. I set my temperature values to expire after six months:
An IoT Data Set is a subset of an IoT Data Store created with IoT SQL which possesses its own data retention period as well as the ability to re-create itself on-demand or on a recurring schedule. Like Data Stores, Data Sets are stored as CSV files in a service-managed bucket. Data Sets ultimately mean that you can create a static data set based on a custom filter (for example, select all temperature data from a narrow yet interesting time frame), generate that data set on-demand once, and retain that filtered data set indefinitely for downstream analytics while allowing the original, raw data store messages to expire according to a retention period that is deemed by your organization to most effectively balance raw data retention against cost-effectiveness.
Some AWS services that integrate with IoT Analytics such as Quicksight will only draw from data sets, while other services such as SageMaker can draw from both data stores and data sets. Generally, all services should be able to draw from data sets. Due to the more limited connectivity with data stores and the cost implications of storing raw data indefinitely in IoT Analytics, in a production use-case you should consider becoming accustomed to the methodology of creating discrete, filtered datasets to be used in analytics or ML model generation, with the raw data store expiring over time unless your organization deems it acceptable to pay for the full history storage of IoT data.
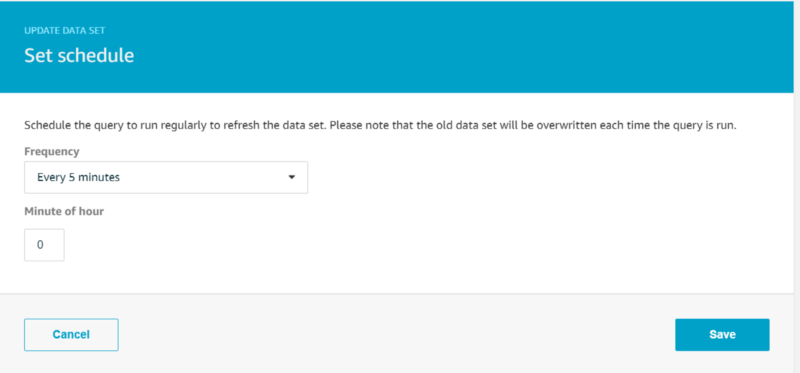
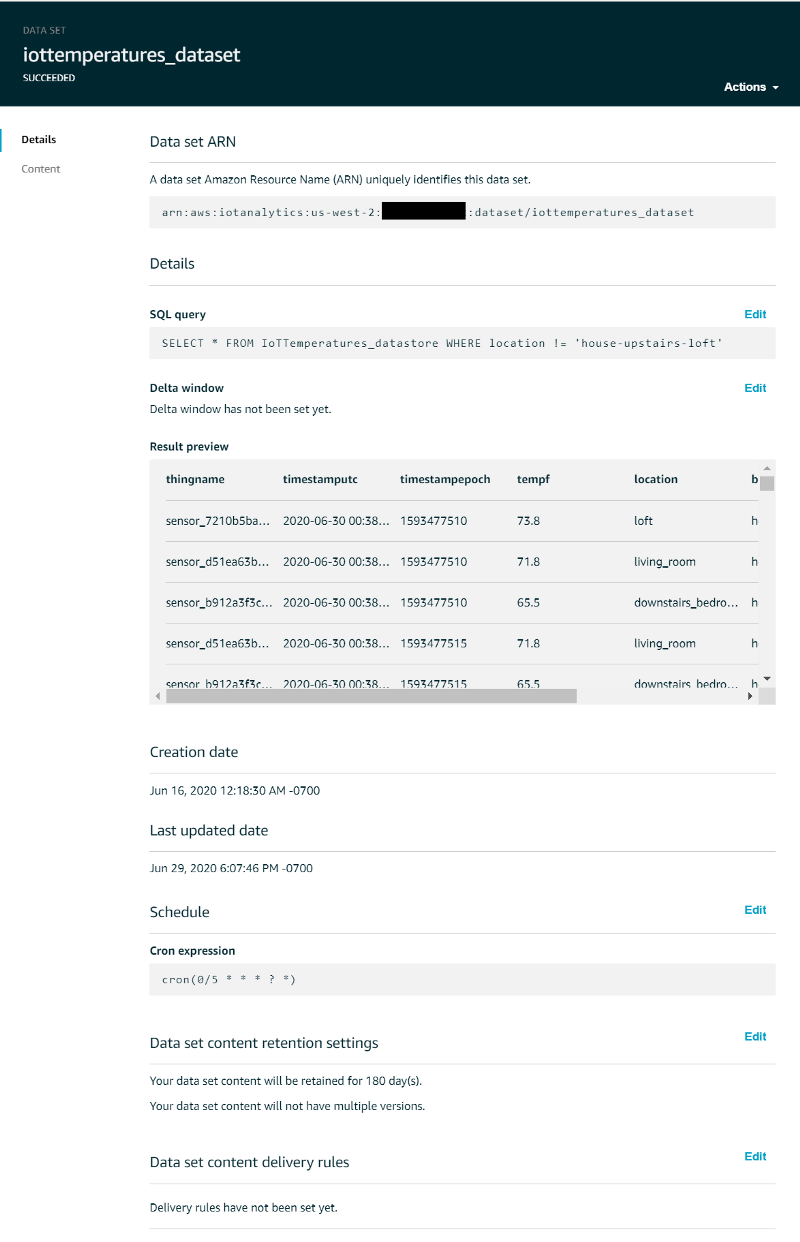
The wizard will have created a data set that selects all data from the data store, however we need to make two updates to it. We do plan on utilizing all data in the data store for our Quicksight visualization so we will leave the SQL query alone. We want Quicksight to utilize the most up-to-date temperature data in its graphs, so rather than running re-creation of the data set on-demand, let’s set up a cron job to re-create the dataset every 5 minutes. Click “Edit” next to “Schedule” and set the desired re-creation frequency:
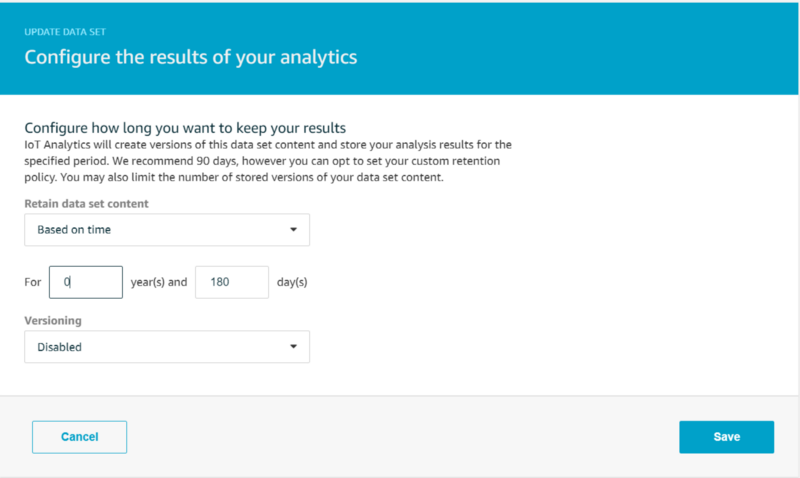
We want the data set to be retained for 180 days, matching our data store retention period, and we want to disable multiple version retention:
The data set to be used for Quicksight should look like the following:
Visualization of streaming data
With our temperature dataset ready, let’s check out AWS Quicksight’s visualization capabilities. Navigate to the Quicksight service and select the “Standard edition” QuickSight account type to keep your demo cheap:
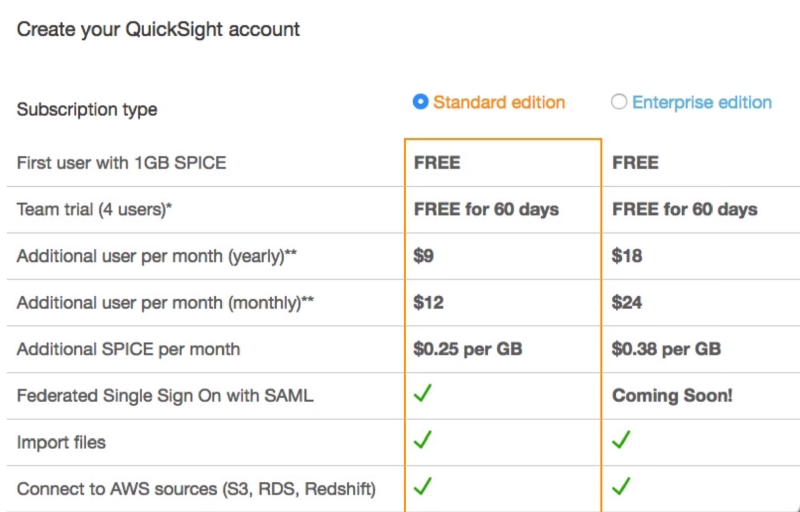
Looking beyond the marketing terms, SPICE is simply Quicksight’s in-memory computation engine for quickly generating ad hoc analyses and visualizations. With just a few in-home IoT devices worth of data the 1 GB SPICE free tier will be more than sufficient for this walkthrough.
Once your QuickSight account has finished creating, you will be taken to a dashboard listing several example analyses the service provides by default. If you click on “Manage data” in the upper-right, you will also see the data sources powering the example analyses. Before we create an IoT temperature analysis dashboard, we need to set up our IoT Analytics data set as a data source. Click “New dataset” from the “Manage data” screen and choose IoT Analytics from the list of supported sources:

The IoT Analytics data store we created will be displayed. Select that and click “Create data source”, then click “Visualize” once complete:
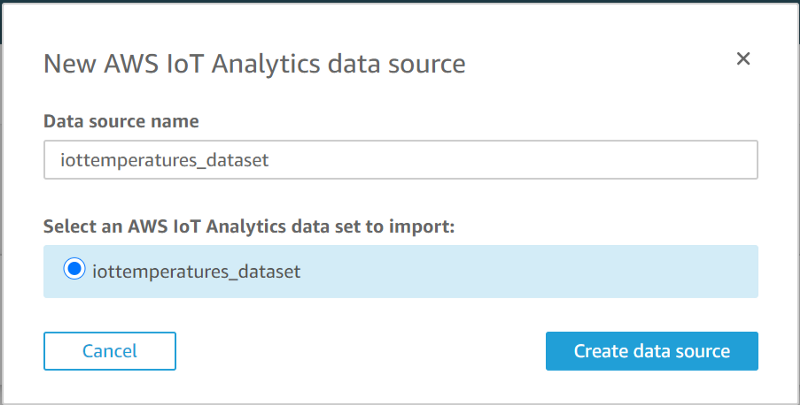
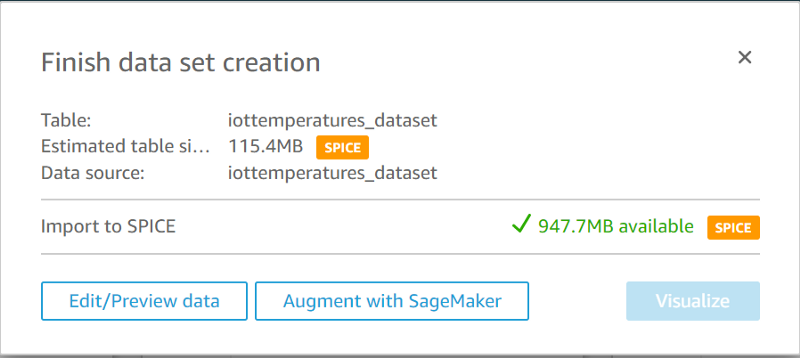
This will bring you to an empty AutoGraph:
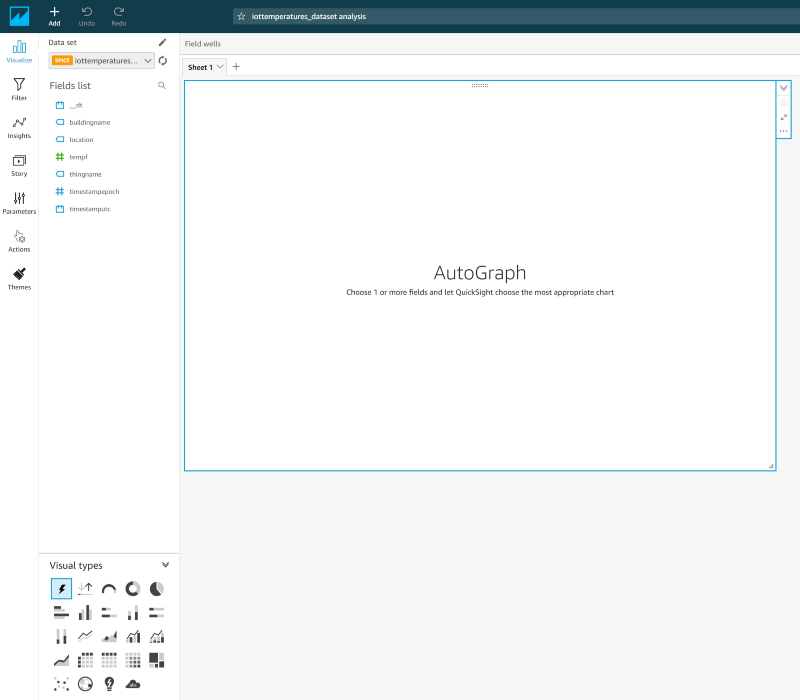
Knowing that time series data will be well-represented by a Line chart, select that option under “Visual types”. This will then transform the workspace and allow us to add an x-axis dimension, values, and a group-by color:

Drag-and-drop “timestamputc” to the X axis, “tempf” to Value, and “location” to Color. Once your data is visualized, select the drop-down arrow on your y-axis and change your displayed value from a Sum to an Average:
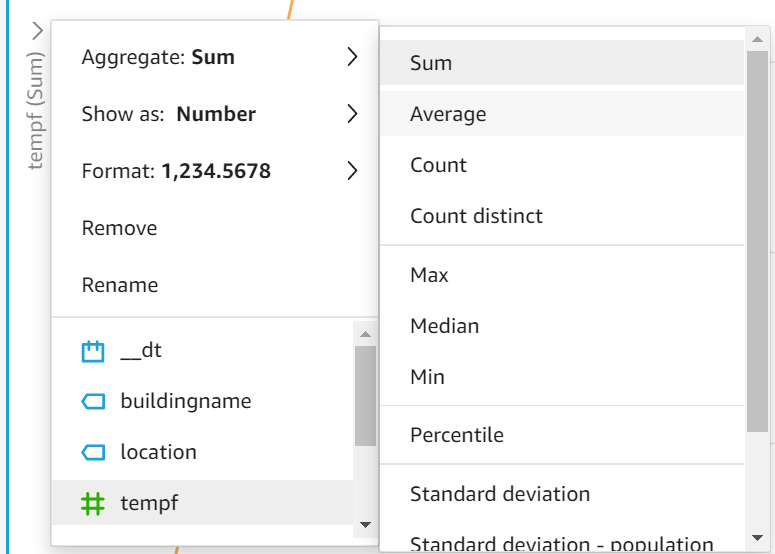
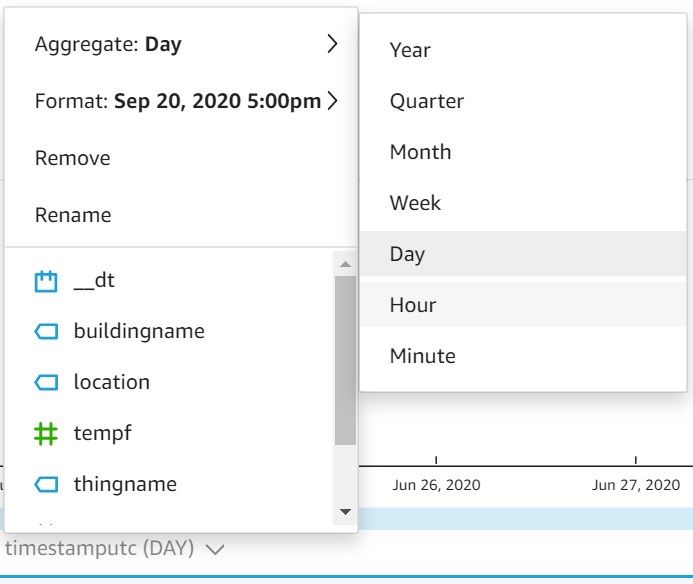
Next, change your x-axis to aggregate the average temperature values on Hour rather than Day:
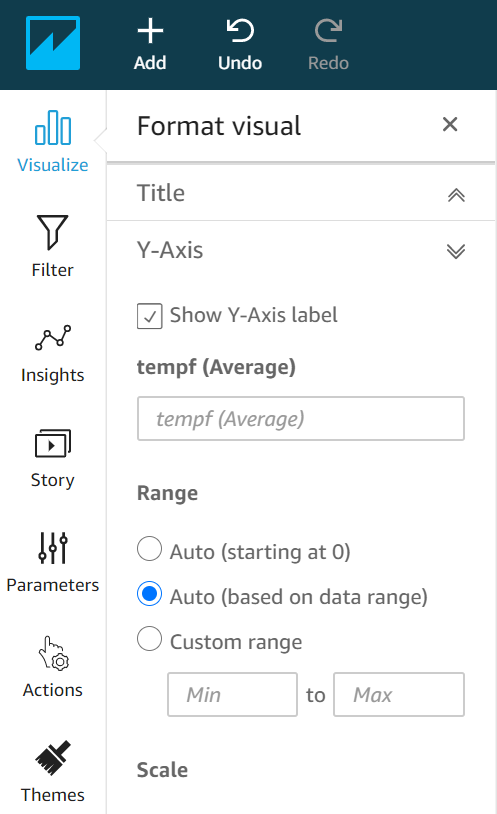
To better vertically scale your data, click on the gear icon in the upper-right corner of your figure to display a list of visual formatting options. Choose the y-axis and select option “Auto (based on data range)” rather than the default “Auto (starting at 0)”:
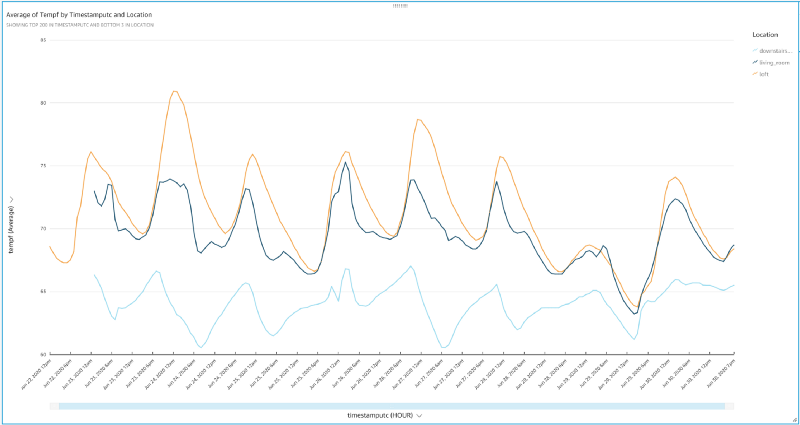
And voila! You should now be presented with an elegant figure displaying IoT-streamed temperature values that cycle up and down throughout the day. We can identify a few interesting features just glancing at the chart:
- This project has confirmed my observation that the downstairs part of my house is a winter wonderland despite the thermostat on the ground floor being set to a constant 72 degrees throughout this experiment.
- The ground floor shows large, >5 degree variability in temperature while trying to maintain 72 degrees in spite of double-paned windows throughout the home. Maybe it’s time to get a smart thermostat and have my HVAC checked out?
- I was surprised how variable and poorly cooled the loft is, particularly on hot days such as June 24th. The loft sits in the same open room as the thermostat and directly above it, yet we see that on hot days such as the 24th that the loft is ~8 degrees hotter than the space 10 feet below it.
- Opening windows on cooler days such as the 25th, 26th, and 29th had the effect of equalizing the loft and living room temps, although the downstairs still managed to remain frigid. There’s just no substitute for a cool breeze rolling through your house!
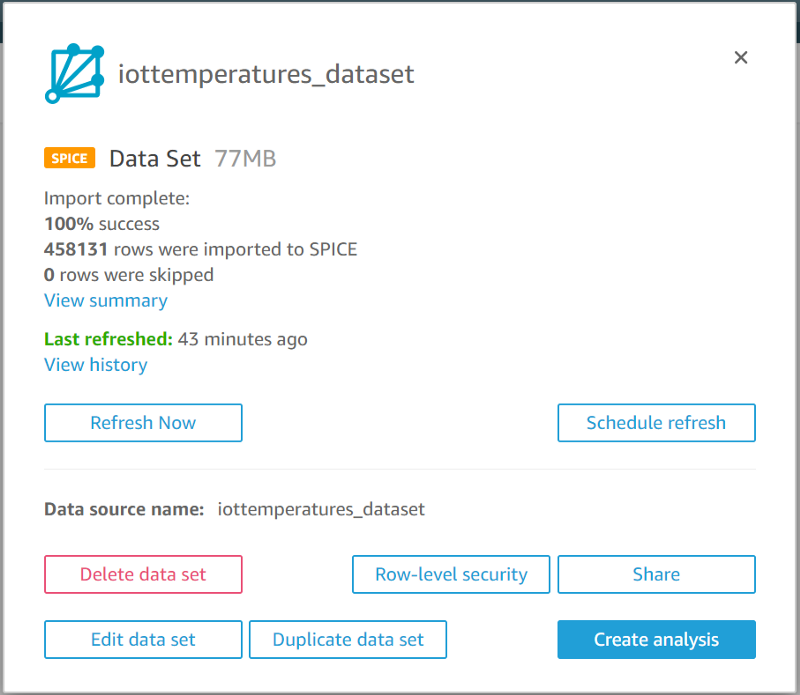
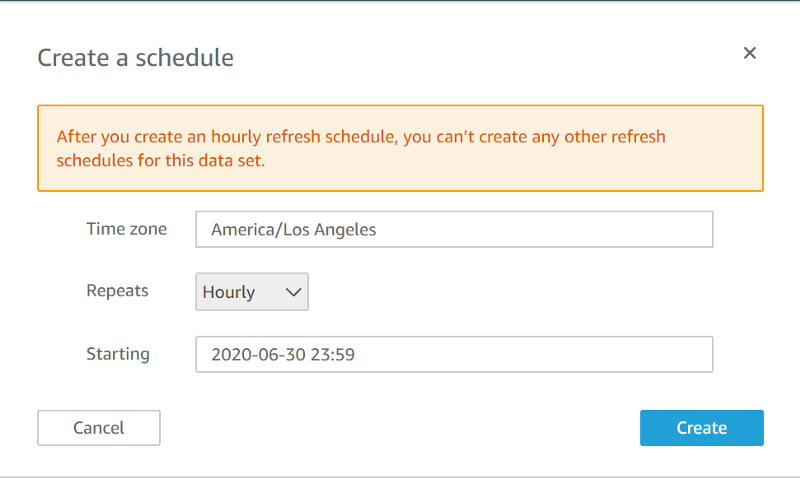
To make sure that your QuickSight visualization is consistently up-to-date with your regularly refreshed IoT Analytics data set, head back to the source Quicksight dataset and set up a refresh schedule:
You now have a regularly updated visualization dashboard that you could provide to other individuals in your company via the Quicksight domain for production-scale IoT streaming data, all without having to manually maintain the infrastructure for storage, shuttling, and stunning visualization of data.
That concludes this tour through production-scale best practices for IoT data streaming, storage, and visualization! I hope you had fun identifying interesting temperature trends in your own home and learned a few things about serverless on AWS along the way. Good luck with your IoT journey!
