This post continues from Part One, where we walked through how to securely onboard a production-scale fleet of IoT devices streaming telemetry data to your Google Cloud environment via IoT Core and Pub/Sub.
Congrats! You’ve successfully registered several IoT devices — now what?
Your next goal should be to design a system that enables large-scale storage, analytics, and visualization/dashboarding capabilities on your data.
In order to do so, you need to design a data flow architecture well in advance that supports such large-scale data operations. This article provides a hands-on walkthrough for doing just that.
Overview
This discussion is broken up into the following sections:
- Batching loading into data sinks
- Storage and analysis of data
- Visualization of warehoused data
Unlike part one, what will be discussed here can be performed entirely through the GCP web console. Only basic SQL experience is required.
The following fully-managed and auto-scaling Google Cloud services will be discussed:
- Pub/Sub — A serverless message queue
- Dataflow — A stream and batch data processing engine
- BigQuery — A serverless data warehouse
- Data Studio — A data visualization/dashboard creation service
Batch loading into data sinks
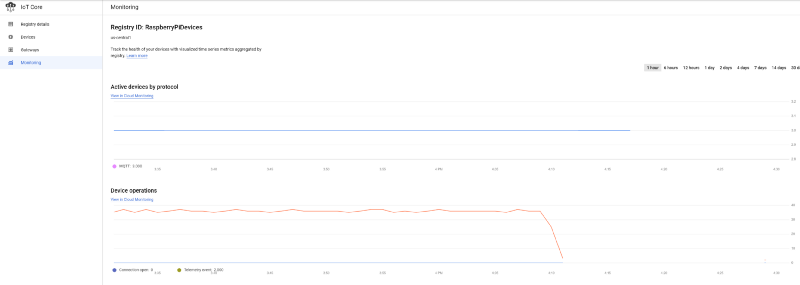
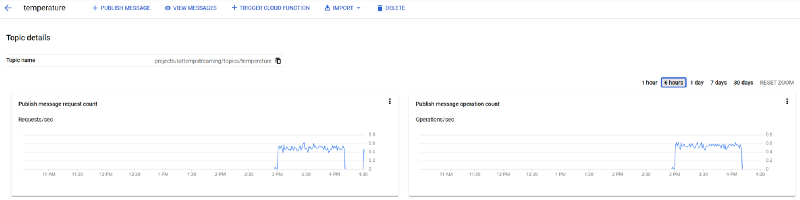
Verify that messages are arriving
If you have successfully onboarded devices into the IoT registry and begun streaming data to the IoT core, you should see a steady stream of messages arriving from the GCP IoT main dashboard:
As shown in Part One, these messages are also arriving in your ‘temperature’ Pub/Sub topic:
Streaming into BigQuery
Nice — We see messages arriving into Google Cloud. Next, we need to move Pub/Sub messages into a data warehouse where the data can reside for the purposes of cost-effective long-term retention, as well as readily-scalable analytics. Enter BigQuery.
BigQuery, Google Cloud’s fully-managed, serverless, and auto-scaling data warehouse, allows you to pay for both compute and storage with an on-demand pricing model, making it a great data sink for storing and analyzing our IoT data.
But how do we stream Pub/Sub messages into BigQuery? With Dataflow.
Dataflow, Google Cloud’s fully-managed and auto-scaling version of Apache Beam, is designed to shuttle data from one service to another. You have the ability to optionally filter and transform data, as well as optimally batch load into load operation-limited services such as databases and data warehousing solutions.
Dataflow contains several Google Cloud-created default templates, including a Pub/Sub-to-BigQuery template, so no coding effort is required to link data ingestion and data storage/analytics services.
Given that Pub/Sub, Dataflow, and BigQuery are all fully-managed and auto-scaling services, and (with the exception of Dataflow) serverless as well, it is possible to build an end-to-end IoT data management system that easily scales from development testing to petabyte-scale operations — with virtually no infrastructure management required as scaling occurs.
Let’s see all these services linked up together in action!
Pub/Sub Subscription Setup
Before we begin moving data from Pub/Sub to Dataflow, we should create a Pub/Sub subscription that is subscribed to the Pub/Sub topic.
Why? Messages hitting a Pub/Sub topic are sent immediately to Pub/Sub topic subscribers (via a Push strategy), then deleted from the topic. By contrast, subscribers can hold on to messages until a process requests messages (via a Pull strategy). It is possible to connect Dataflow to a topic rather than a subscription, but if such a Dataflow job were to experience downtime, messages hitting the topic while Dataflow is down would be lost.
Instead, by connecting Dataflow to a Pub/Sub subscription that is subscribed to the topic, you prevent messages from being lost during downtime. If a Dataflow job were temporarily interrupted, all IoT messages not yet processed by Dataflow would remain in the Pub/Sub subscription, waiting for the Dataflow job to resume pulling messages.
A Pub/Sub subscription to a Pub/Sub topic creates a data architecture that is resilient to downstream data ingestion service interruptions.
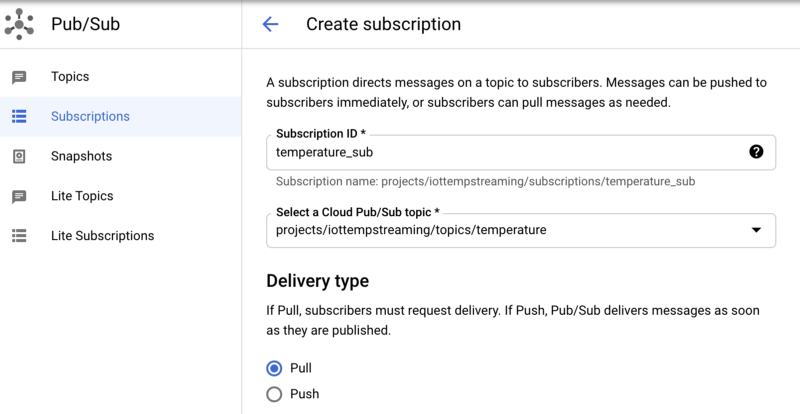
To create a subscription within Pub/Sub:
- Navigate to Subscriptions,
- Click “Create Subscription” and name your subscription “temperature_sub”
- Subscribe this to Pub/Sub topic “temperature”
- Leave the remaining options at their defaults
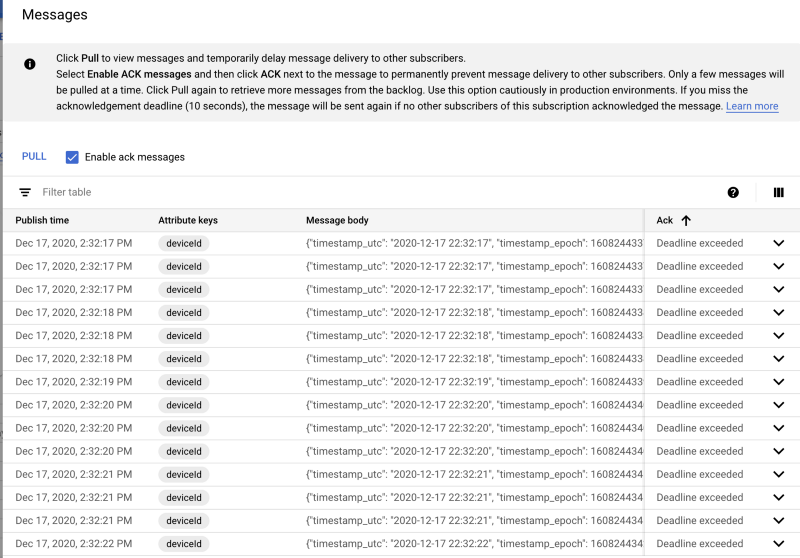
Once created, if you click on the subscription and click “Pull”, you should see messages begin to stream in:
Storage and analysis of data
Now that we have a Pub/Sub subscription receiving messages, we are almost ready to create a Dataflow job to move Pub/Sub messages into BigQuery. Before setting that up, we need to create a table in BigQuery where the data from Dataflow will arrive.
BigQuery Table Setup
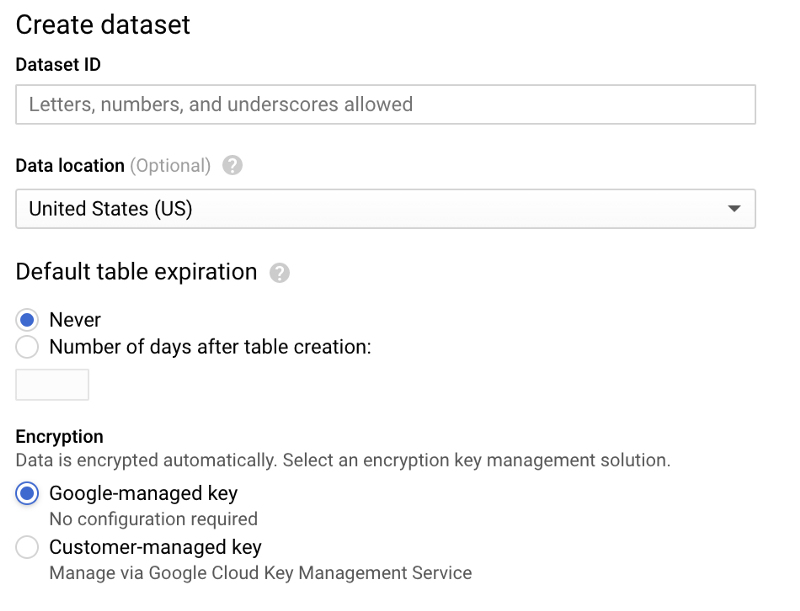
Navigate to BigQuery, click “Create Dataset”, and name your dataset ‘sensordata’, with other options left at their default settings:
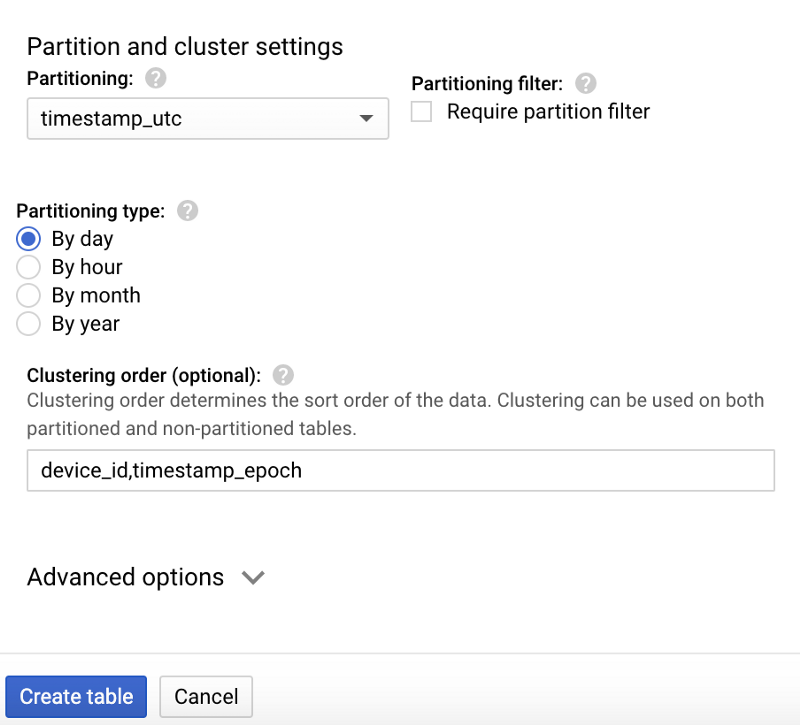
Once the dataset has been created, select it, click “Create table”, and name your new table “temperature”. Make sure you include the schema, partitioning, and clustering options shown in the screenshots below, as these options support common query patterns:
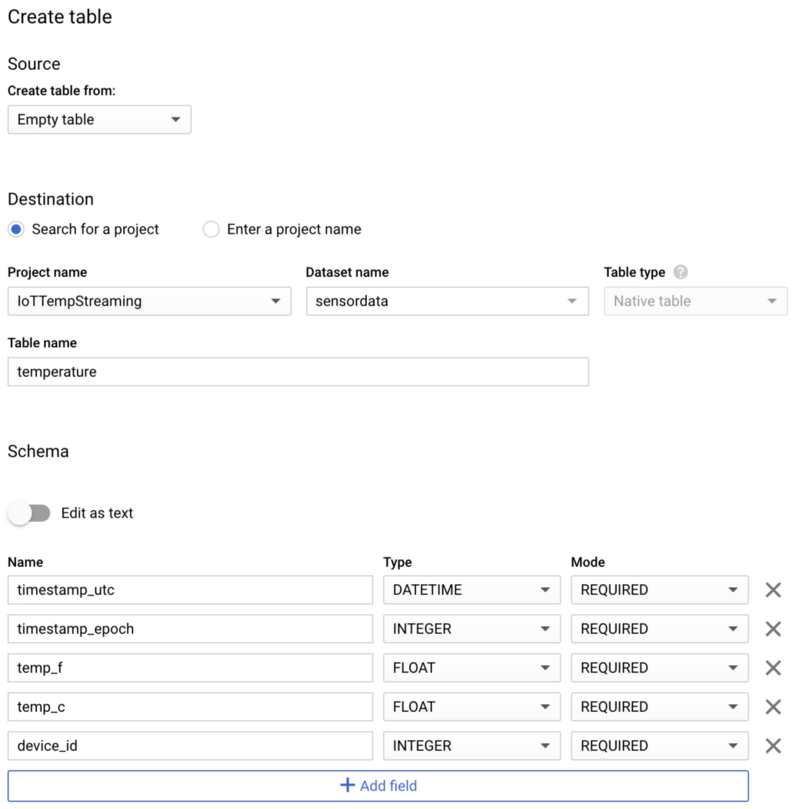
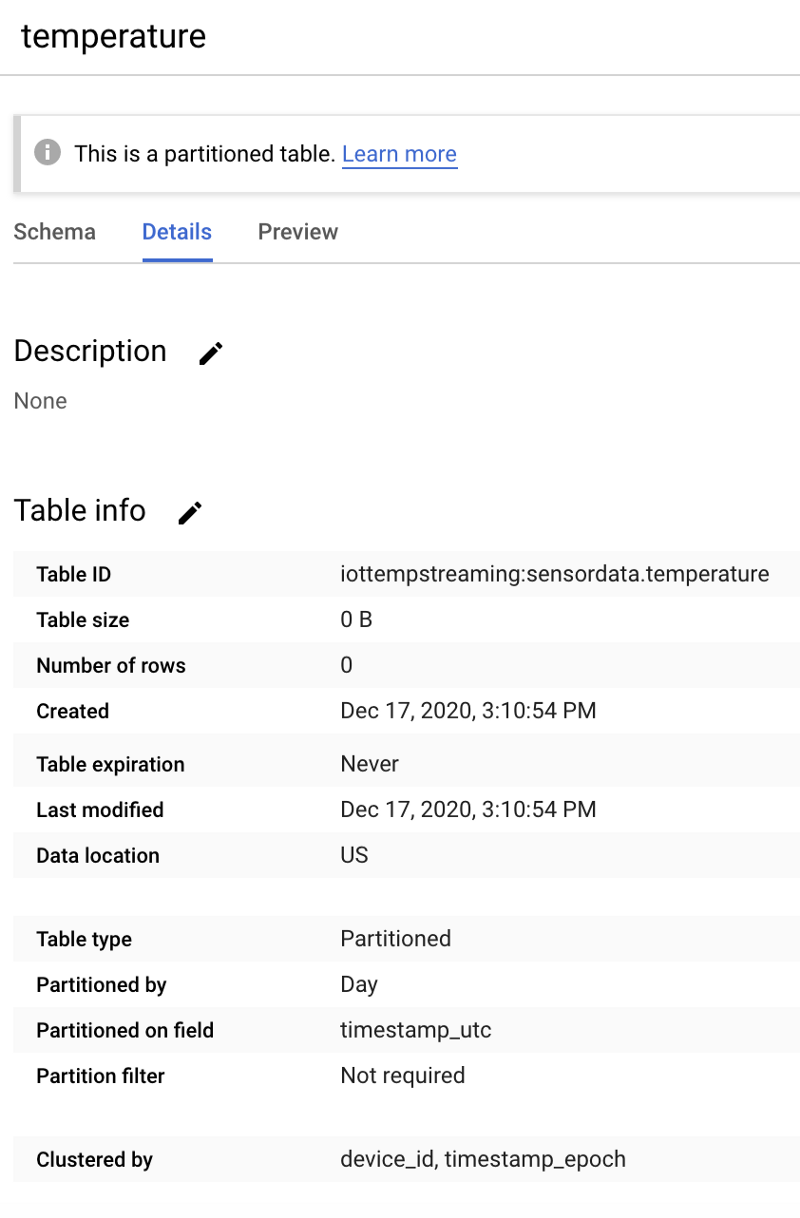
If created correctly, your new, empty table will look like the following:
After moving data into the table, we will showcase a common IoT query pattern: Performing analytics on data matching a specific time frame (e.g. a one-hour window for the present day), and for a specific device.
The table design shown above is ideal for such queries because:
- Partitioning on the UTC timestamp field enables date-specific queries to avoid scanning over DateTime partitions for non-matching days
- Within a partition, clustering (sorting) on deviceId and the epoch timestamp allow for more optimal retrieval of data for a specific device and time-frame within that particular date partition.
To write these queries, we need data to work within the table. Let’s get that Dataflow job going!
Dataflow Setup
We currently have messages sitting in a Pub/Sub subscription, waiting to be moved elsewhere, and a BigQuery table ready to accept those messages. What we need now is the ETL glue that links the two together. Since Pub/Sub and BigQuery are both fully-managed, auto-scaling, and serverless services, we ideally want an ETL tool that possesses these qualities as well.
Dataflow (mostly) matches these requirements. The marketing around Dataflow claims it is all three, but in truth, it is not fully serverless. You do need to specify the instance types and sizes that will be used, the minimum and maximum instance counts auto-scaling can bounce between, as well as how much disk temporary disk space each instance will need. You never manage these instances and their ability to decide when to scale, but you do have to provide these specifications. This is in contrast to Pub/Sub and BigQuery, which will auto-scale with no infrastructure configuration.
Despite not being completely serverless, Dataflow is a perfect fit for our Pub/Sub-to-BigQuery ETL requirement. It is also easy to use, particularly given that GCP offers many default Dataflow job templates, including one that supports a Pub/Sub-to-BigQuery workflow. Outside of having to increase the auto-scaling maximum permissible instance count as your IoT data throughput increases over time, you will in theory never have to worry about managing the infrastructure powering Dataflow.
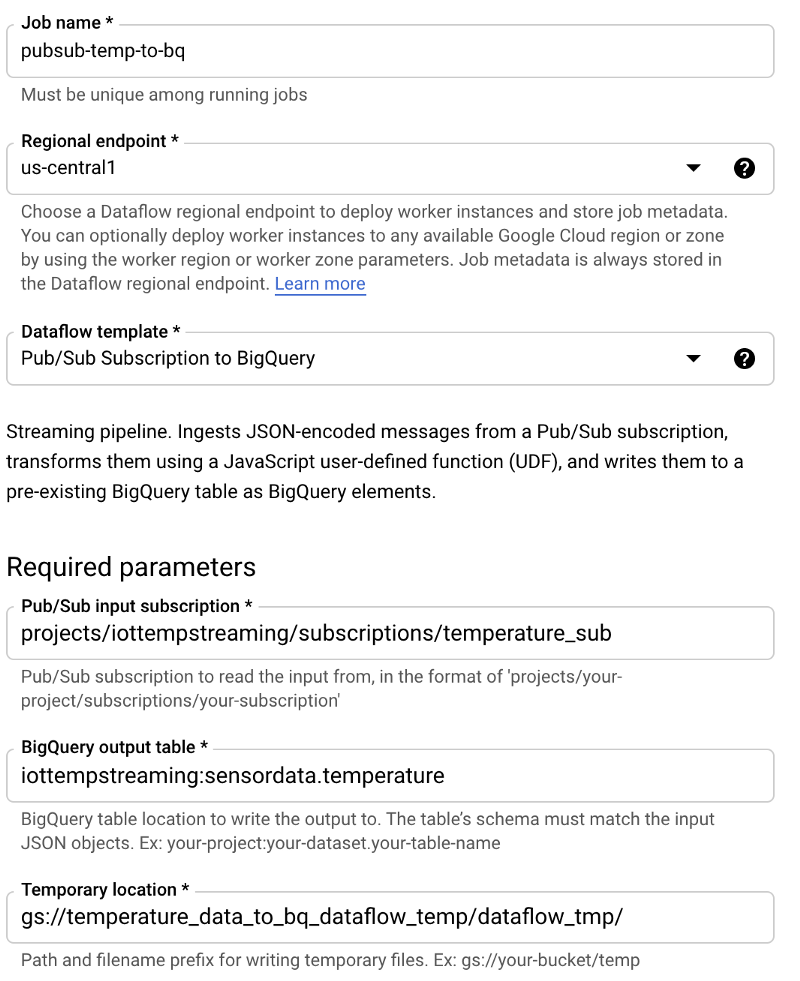
With the basics now understood, let’s implement a Dataflow job. Navigate to Dataflow, click “Create Job from Template”, and follow these steps:
- Name the job ‘pubsub-temp-to-bq’
- Use the default streaming template ‘Pub/Sub Subscription to BigQuery’
- Enter the full Pub/Sub Subscription name
- Enter the full BigQuery table ID
- Enter a Cloud Storage bucket location where temporary data may be stored as part of Dataflow’s process for batch loading into BigQuery
- Leave the remaining options at their defaults. You typically would expand the Advanced Options and specify parameters such as a particular machine type and size to use, the min/max machine count auto-scaling values, and disk size per machine. However, for testing purposes, these can be left at their defaults.
Your Dataflow job creation screen should look like the following:
After hitting “Create” and waiting a few minutes for the underlying infrastructure to spin up and start running, you will see data flowing from the Pub/Sub subscription and into the destination BigQuery table.
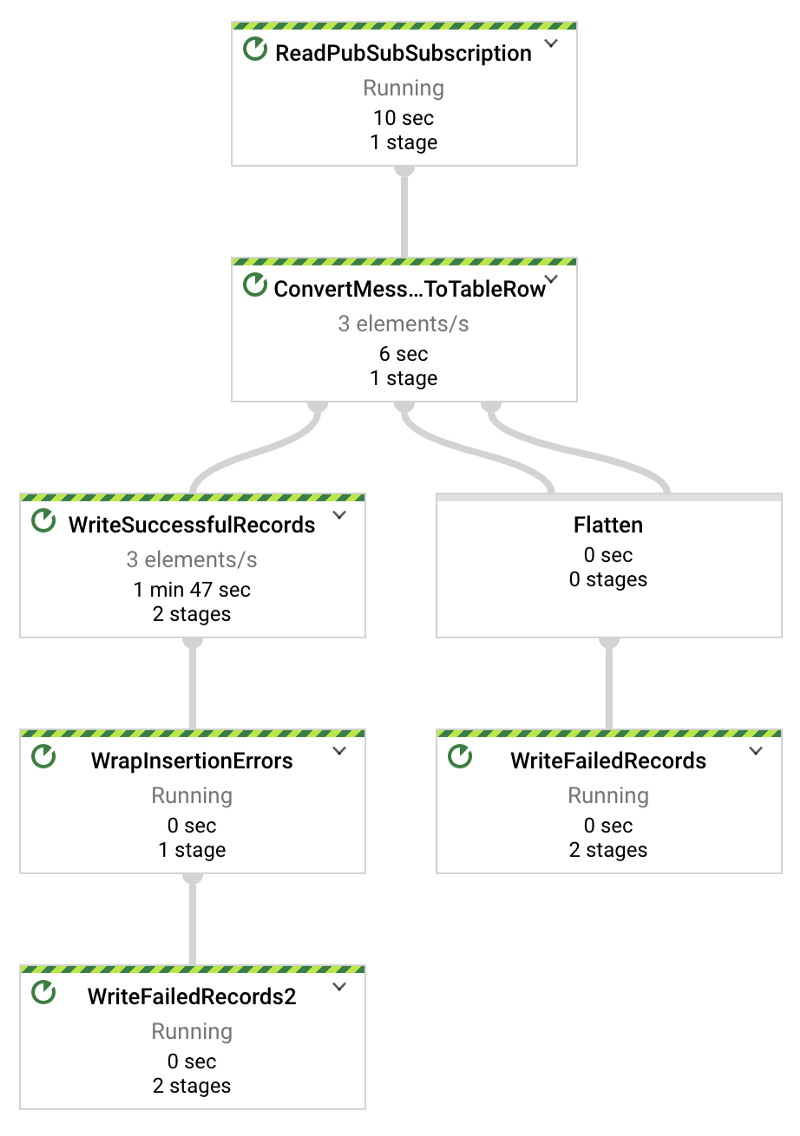
The Python temperature streaming script provided in Part One streams at a rate of one record per second. Thus, in the Dataflow Directed Acyclic Graph (DAG) shown below, you should see x number of elements streaming per second, where x is the number of devices you are testing with. In my case, there are three devices streaming:
Once you see that the Dataflow job is active and successfully streaming Pub/Sub subscription data to BigQuery, you can run a query with the following format in BigQuery and see real-time data hitting the table:
SELECT *
FROM `iottempstreaming.sensordata.temperature`
WHERE DATE(timestamp_utc) = "2020-12-18"
ORDER BY timestamp_epoch DESC
LIMIT 10
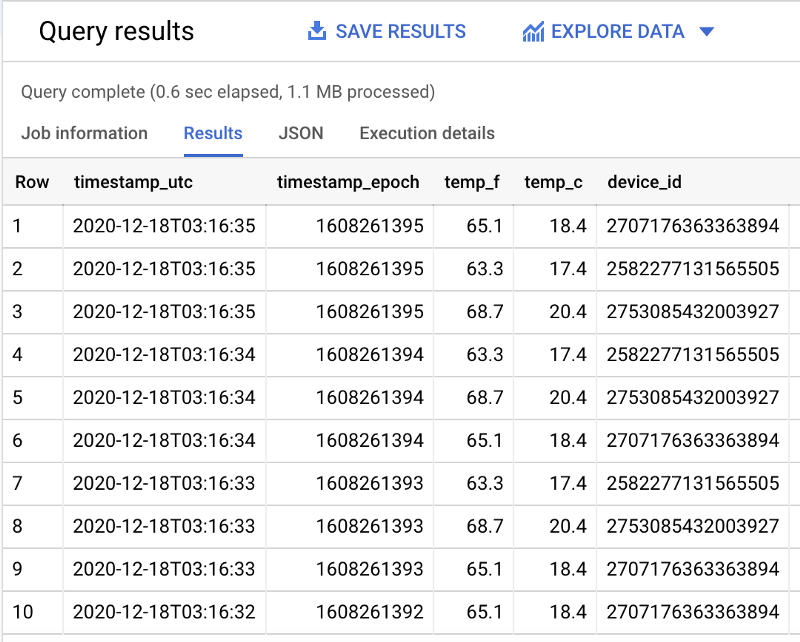
We see that partition filtering is taking place by observing that more total data is scanned when the day-filtering WHERE clause is removed.
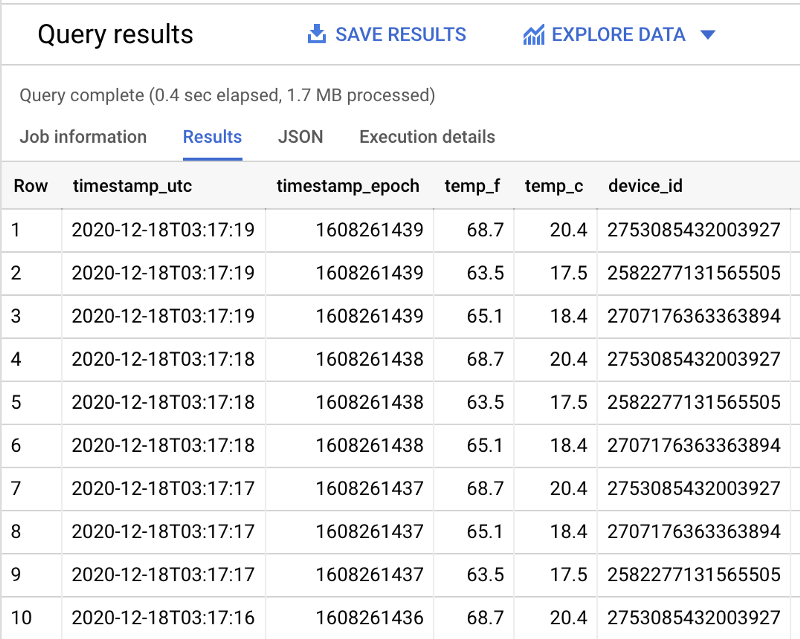
With my example dataset, 1.1 MBs of filtered data are scanned (as seen above) and 1.7 MBs of unfiltered data are scanned (shown below):
SELECT *
FROM `iottempstreaming.sensordata.temperature`
ORDER BY timestamp_epoch DESC
LIMIT 10
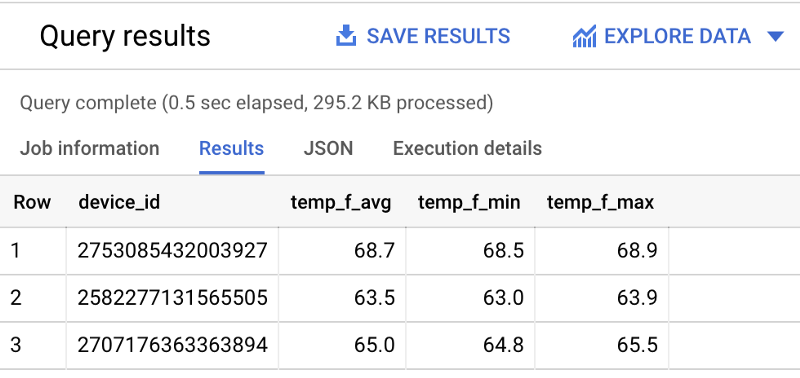
Let’s see what the average, minimum, and maximum temperature values are from each sensor within the past hour:
SELECT
  device_id,
  ROUND(AVG(temp_f), 1) AS temp_f_avg,
  MIN(temp_f) AS temp_f_min,
  MAX(temp_f) AS temp_f_max
FROM `iottempstreaming.sensordata.temperature`
WHERE timestamp_utc > DATETIME_ADD(CURRENT_DATETIME(), INTERVAL -60 MINUTE)
GROUP BY device_id
Congratulations! You have just set up a data workflow that is fully-managed from end-to-end, from data ingestion to the analytics backend. Before we wrap this walkthrough up, let’s quickly check out how easily this data can be visualized with Data Studio.
Visualization of warehoused data
Start by running a query similar to the following in BigQuery which grabs all rows of data from a particular day:
SELECT *
FROM `iottempstreaming.sensordata.temperature`
WHERE DATE(timestamp_utc) = "2020-12-18"
ORDER BY timestamp_epoch DESC
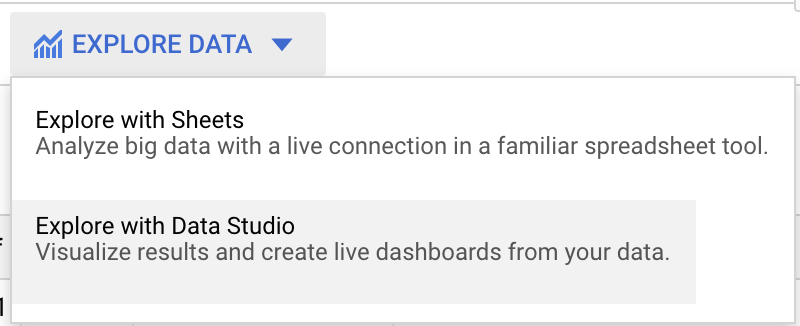
To the right of “Query Results”, click on “Explore Data”, then “Explore with Data Studio”:
This will load a table summarizing the data we just queried. However, by default, it will show a rather uninteresting table summarizing the total number of records streamed per second.
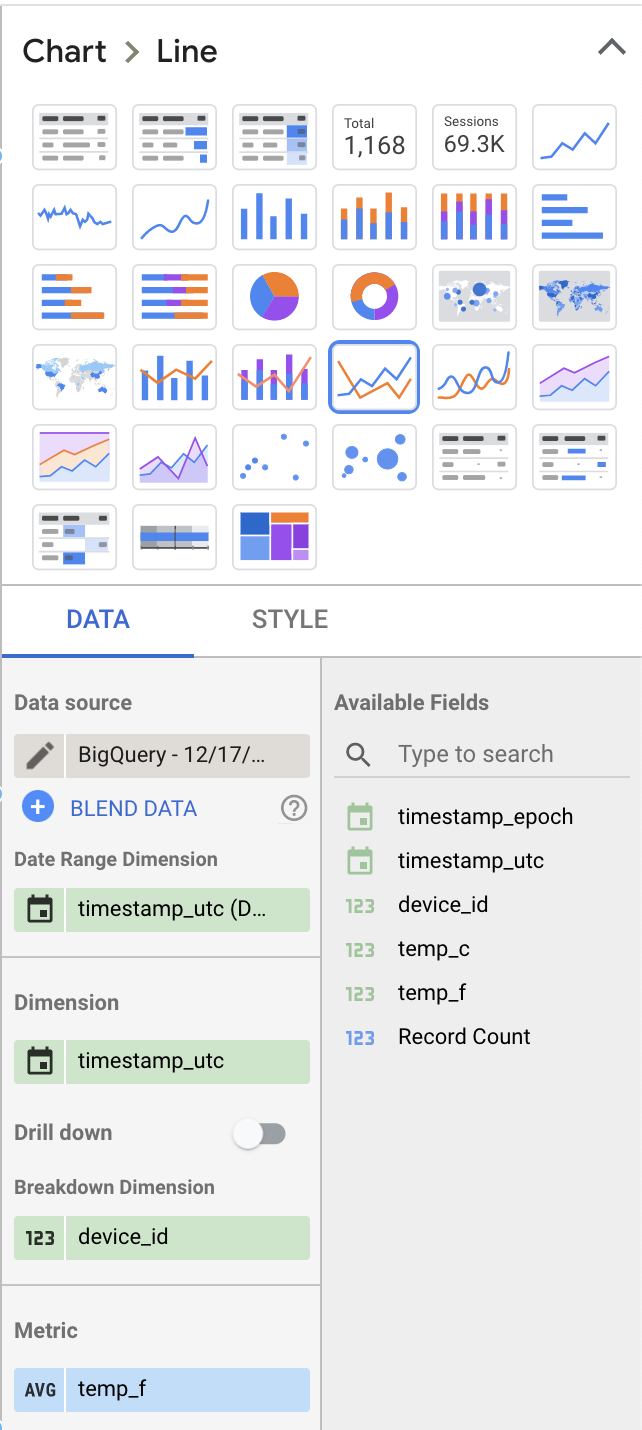
Let’s change a few values under the Data section on the right to make this more interesting:
- Select “Line Chart” as the visualization type rather than “Table”
- Remove “Record Count” as the Metric viewed, and replace this with “temp_f”. Make sure to change the default “SUM” metric to “AVG”.
- Add “device_id” as a breakout dimension
Your choices should give dashboard layout settings similar to the following:
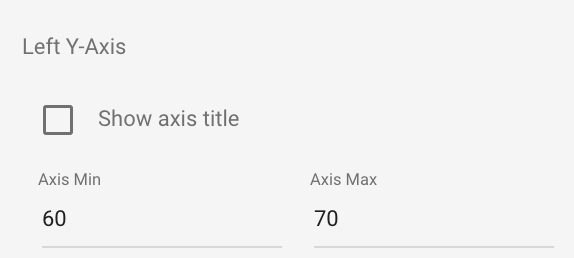
The chart that this produces will show temperature values for each device over time, but it may not be auto-scaled well as the default minimum y-axis value will be zero. To fix this, click on the “Style” tab, scroll down until you get to option “Left Y-Axis”, and change these to reasonable values:
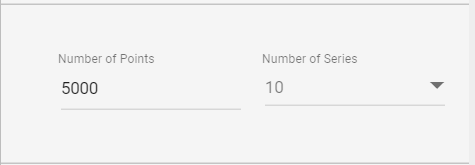
You may also want to increase the number of data points that can be present on the chart:
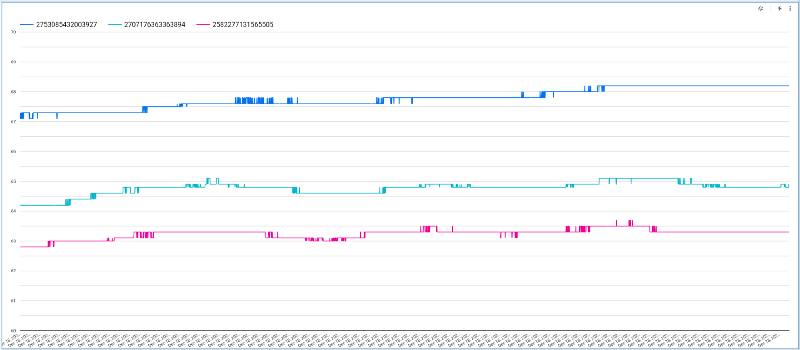
With these updates, you should have a beautiful, interactive chart that allows you to scroll through device temperature values as they fluctuate over time:
Next up: Machine Learning
Stay tuned for part three where we will build a functional machine learning model on this BigQuery dataset and use it to generate real-time predictions.